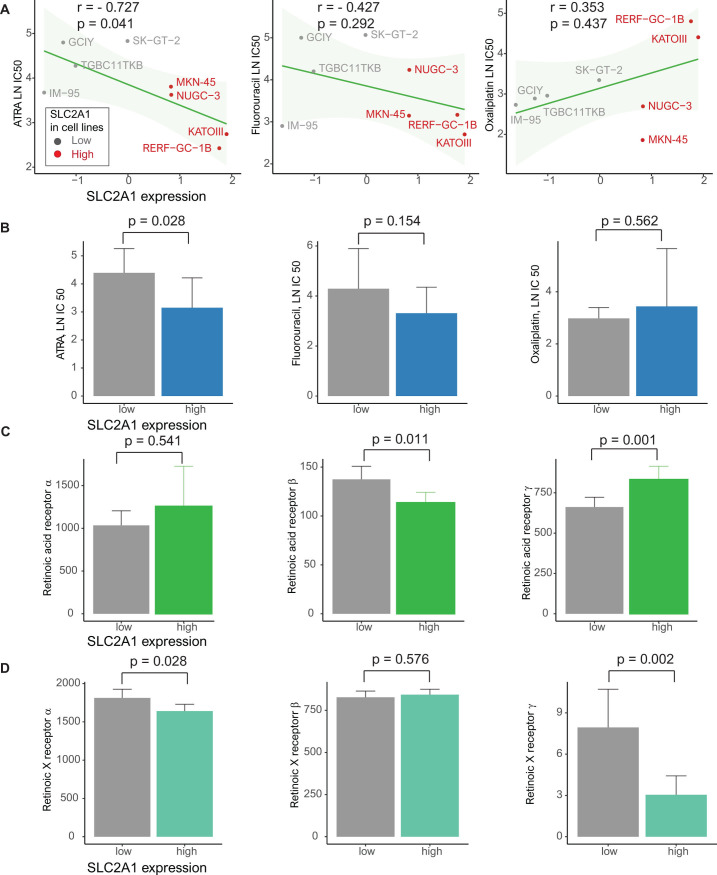
Fig 4. Genomics of drug sensitivity in cancer (GDSC) database analysis.
(A) Pearson’s correlations showing the natural log of the half-maximal inhibitory concentration (LN IC50) values of ATRA, fluorouracil and oxaliplatin in gastric cancer cell lines (gray, low SLC2A1 expression; red, high SLC2A1 expression). (B) Bar plot showing the LN IC50 values of ATRA, fluorouracil and oxaliplatin between gastric cancer cell lines with low (gray) and high (blue) SLC2A1 expression (p = 0.022, 0.852 and 0.377, respectively) (error bars: standard errors of the mean). (C) TCGA database: bar plot of the expression of the retinoic acid receptors (RARs) RARα, RARβ and RARγ between patients with gastric cancer with low (gray) and high (green) SLC2A1 expression (p = 0.541, 0.011 and 0.001, respectively) (error bars: Standard errors of the mean). (D) TCGA database: Bar plot of the expression of the retinoic X receptors (RXRs) RXRα, RXRβ and RXRγ between patients with gastric cancer with low (gray) and high (blue green) SLC2A1 expression (p = 0.028, 0.576 and 0.002, respectively) (error bars: Standard errors of the mean).

