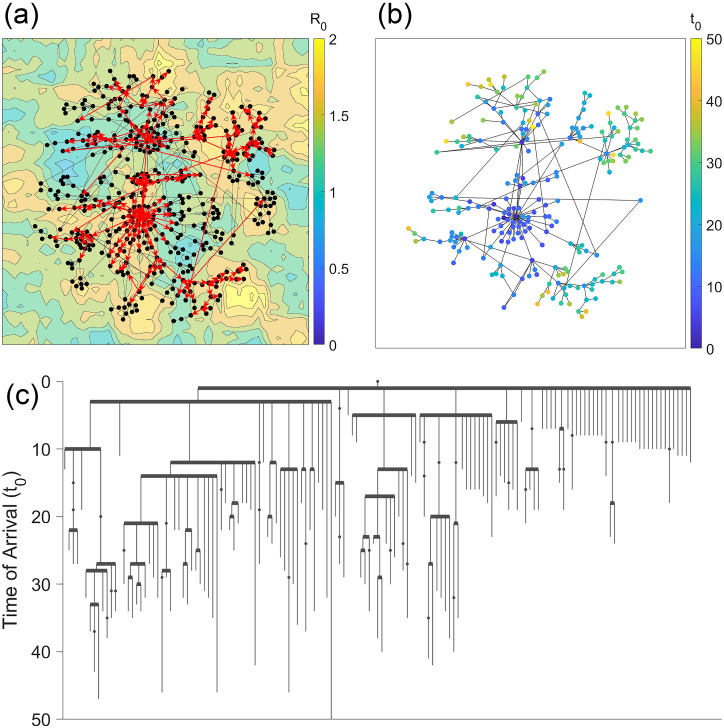
Fig 1.
(a) An example of a human network model with 1000 nodes and 1,000,000 individuals. A stochastic metapopulation SIR model was processed on this network, and the red arrows represent the spread of the outbreak. (b) A data tree showing the order in which the outbreak spread throughout the network. Nodes are sorted by the order in which they first spread the infection to a neighboring node, and the y-axis represents the time of arrival of the epidemic.

