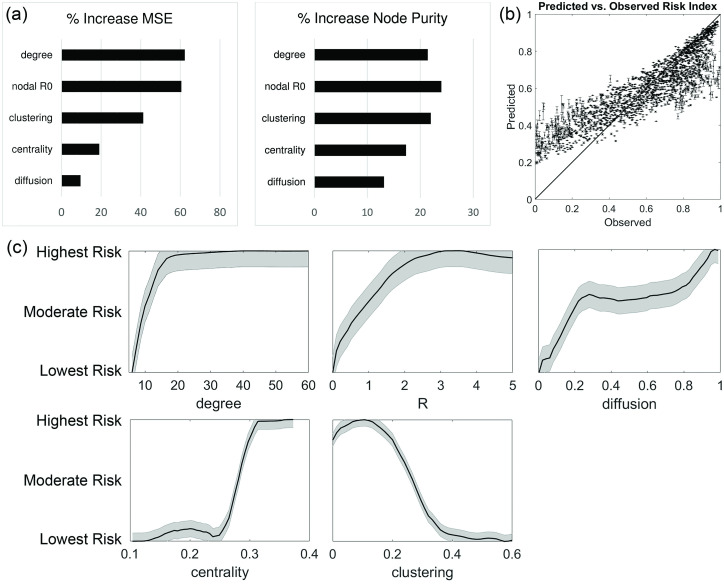
Fig 5. One-variable response curves of superspreader risk in terms of degree, R, diffusion, centrality, and clustering.
Note that these curves have been rescaled for clarity. A scatter plot showing observed versus predicted risk indices for individual nodes is also shown, with a line indicating a 1:1 relationship.

