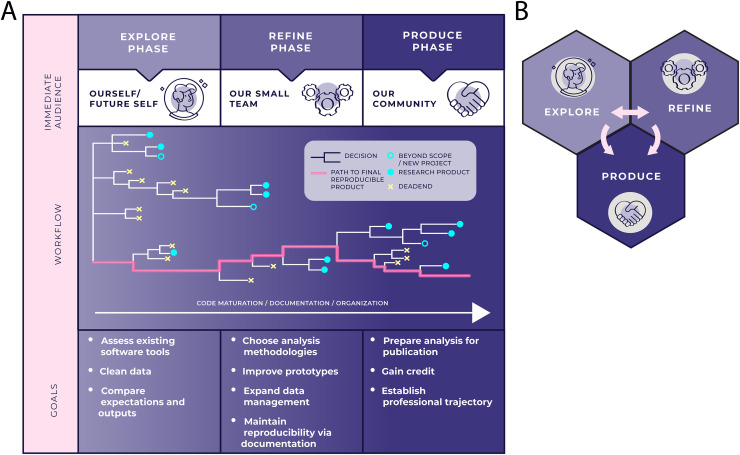
Fig 1. ERP workflow for data-intensive research.
(A) We deconstruct a data-intensive research project into 3 phases, visualizing this process as a tree structure. Each branch in the tree represents a decision that needs to be made about the project, such as data cleaning, refining the scope of the research, or using a particular tool or model. Throughout the natural life of a project, there are many dead ends (yellow Xs). These may include choices that do not work, such as experimentation with a tool that is ultimately not compatible with our data. Dead ends can result in informal learning or procedural fine-tuning. Some dead ends that lie beyond the scope of our current project may turn into a new project later on (open turquoise circles). Throughout the Explore and Refine Phases, we are concurrently in the Produce Phase because research products (closed turquoise circles) can arise at any point throughout the workflow. Products, regardless of the phase that generates their content, contribute to scientific understanding and advance the researcher’s career goals. Thus, the data-intensive research portfolio and corresponding academic CV can be grown at any point in the workflow. (B) The ERP workflow as a nonlinear cycle. Although the tree diagram displayed in Fig 1A accurately depicts the many choices and dead ends that a research project contains, it does not as easily reflect the nonlinearity of the process; Fig 1B’s representation aims to fill this gap. We often iterate between the Explore and Refine Phases while concurrently contributing content to the Produce Phase. The time spent in each phase can vary significantly across different types of projects. For example, hypothesis generation in the Explore Phase might be the biggest hurdle in one project, while effectively communicating a result to a broader audience in the Produce Phase might be the most challenging aspect of another project.

