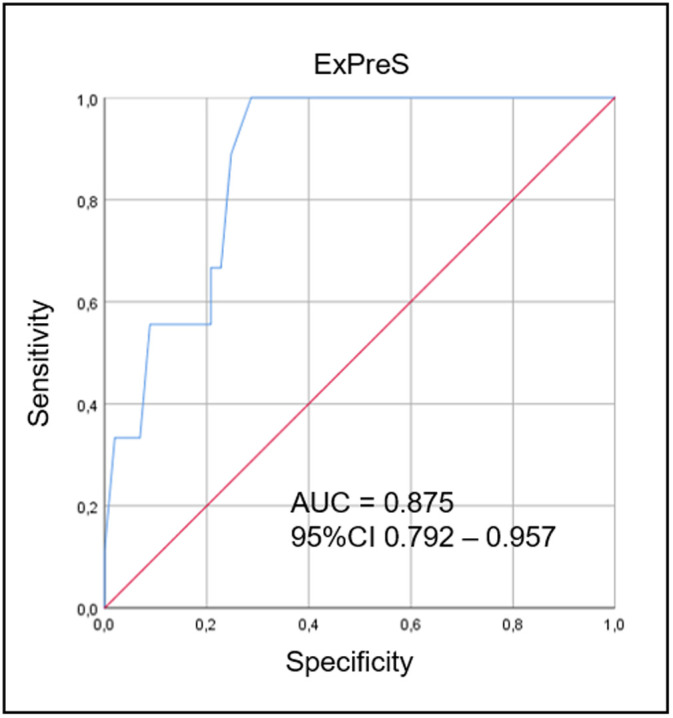
Fig 4. ROC curves for ExPreS from derivation cohort, used to distinguish the extubation success group from the failure group.

In the ROC curve analysis, the AUC was 0.875. ROC curve: receiver operating characteristic curve; ExPreS: Weaning and Extubation Predictive Index; AUC: area under the curve, CI: confidence interval.
