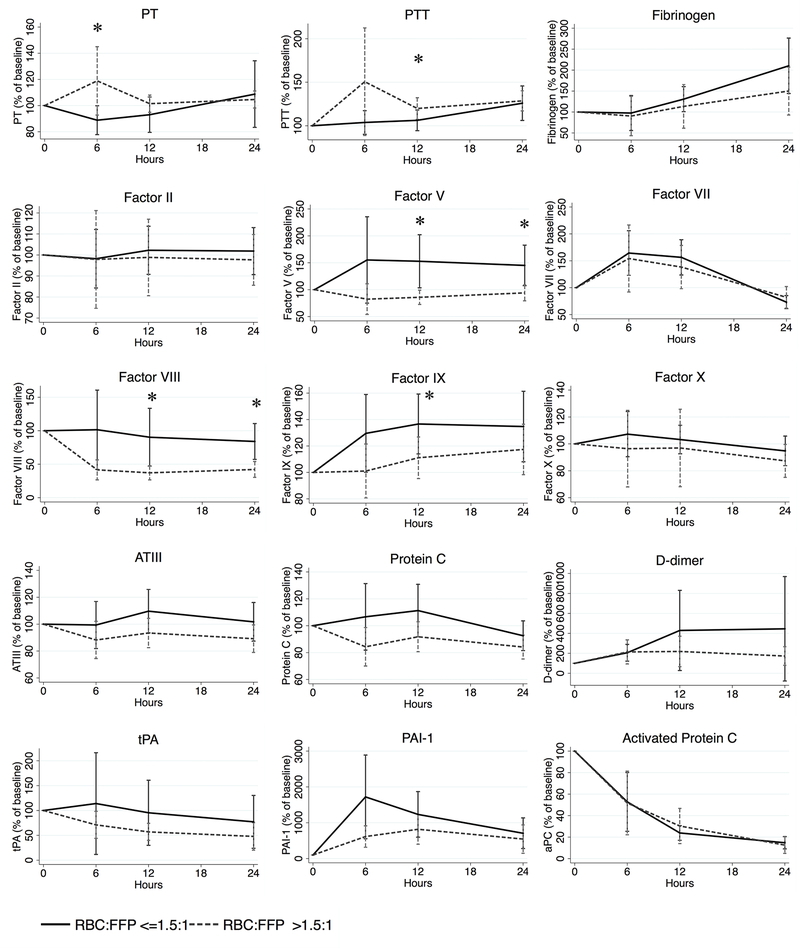
Figure 1.
Longitudinal percentage change in coagulation studies by ‘high’ versus ‘low’ RBC:FFP resuscitation ratio compared to admission baseline
RBC = red blood cells; FFP = fresh frozen plasma; PT = prothrombin time; PTT = activated partial thromboplastin time; AT III = antithrombin III; aPC = activated Protein C; tPA = tissue plasminogen activator; PAI-1 = plasminogen activator inhibitor-1. N=143. *p <0.05 for comparison between ‘low’ and ‘high ratio’ patients at each time point.

