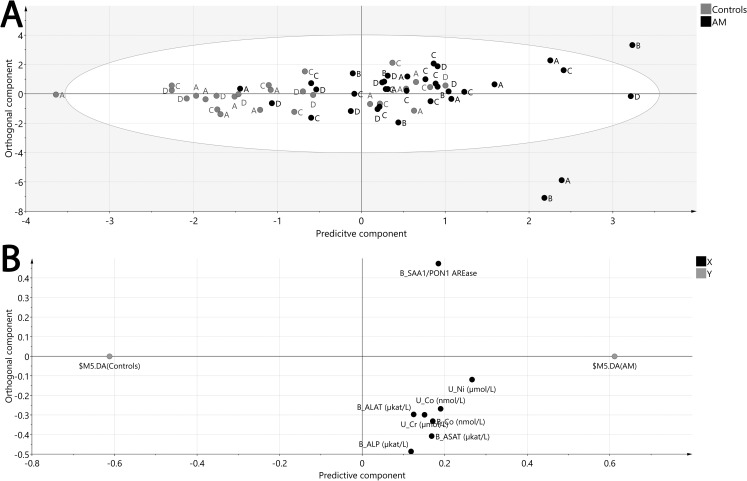
Fig 3. Multivariate modelling using OPLS-DA of AM operators and controls Monday and Friday both years.
A. Score plot showing the separation of AM operators (black) and controls (grey) during Monday year 1 (A), Friday Year 1 (B), Monday Year 2 (C) and Friday Year 2 (D). B. Loading plot showing the variables responsible for the separation of samples. R2 = 0.34, Q2 = 0.30, CV-ANOVA p-value < 0.001.

