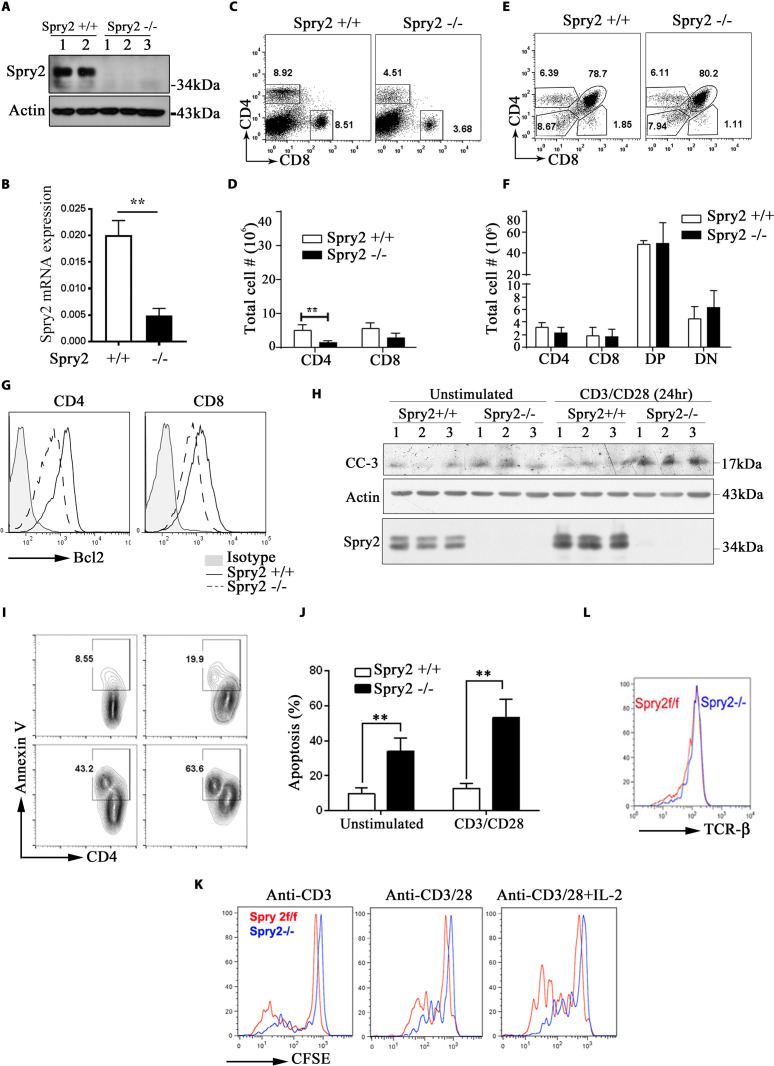
Fig 1. Effect of Spry2 deletion on T cells.
(A) CD4+ T cells from Tamoxifen-treated Spry2f/f (Spry2+/+) (n = 2) and ERT2-Cre:Spry2f/f (Spry2−/−) mice (n = 3) analyzed by western blot to confirm Tamoxifen-inducible deletion of Spry2. (B) Real-time PCR analysis of basal Spry2 mRNA expression in splenic CD4+ T cells from Spry2+/+ and Spry2−/− mice (n = 3). (C, D) Representative dot plot and statistical analysis of splenic CD4+ and CD8+ T cells from Spry2+/+ and Spry2−/− mice (n = 3). (E, F) Representative dot plot and statistical analysis of SP CD4+, CD8+, DP and DN thymocytes from Spry2+/+ and Spry2−/− mice (n = 3). (G) Histogram of Bcl2 expression in splenic CD4+ and CD8+ T cells from Spry2+/+ and Spry2−/− mice (n = 3). (H) Western blot showing CC-3 levels in splenic CD4+ T cells from Spry2+/+ and Spry2−/− mice (n = 3). (I, J) Annexin-V staining analysis of unstimulated or anti-CD3/CD28-stimulated CD4+ T cells from Spry2+/+ and Spry2−/− mice (n = 3). (K) Proliferation analysis of CFSE-labeled CD4+ T cells from Spry2+/+ and Spry2−/− mice after 72 h culture (n = 3) (L) Histogram of surface TCR-β expression in CD4+ T cells from Spry2+/+ and Spry2−/− mice. Values represent mean ± SEM. ** p < 0.005 by unpaired Student t test. All the data of this figure can be found in the S1 and S2 Data files. Bcl2, B cell lymphoma 2; CC-3, Cleaved Caspase-3; CFSE, carboxyfluorescein succinimidyl ester; DN, double-negative; DP, double-positive; SP, single-positive; Spry2, Sprouty2; TCR-β, T cell receptor beta.

