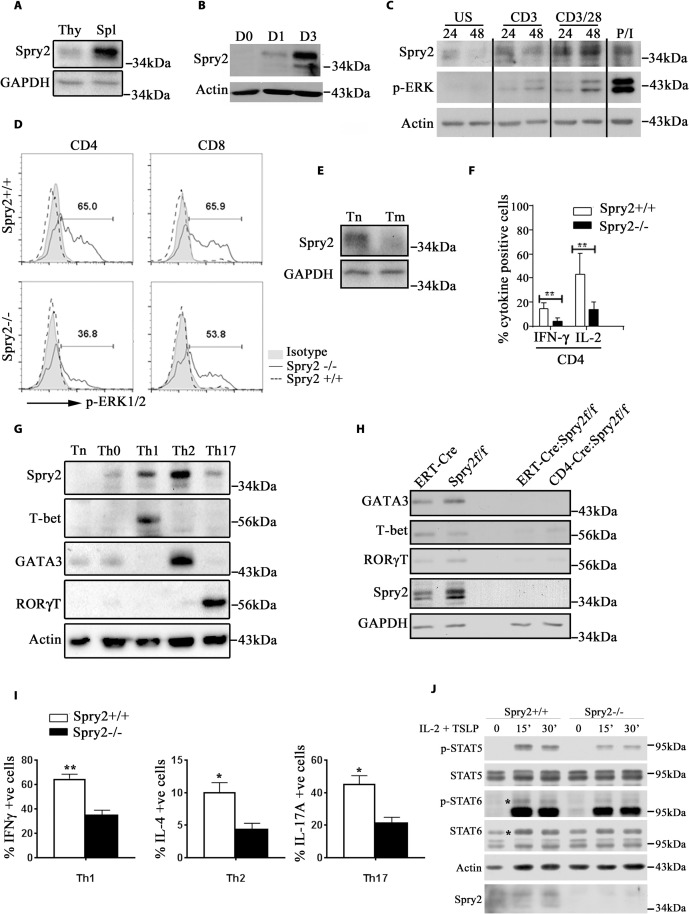
Fig 2. Spry2 deficiency abrogates ERK activation, T cell differentiation, and cytokine secretion.
(A) Immunoblot of basal Spry2 expression in Thy and Spl from B6 mice (n = 2) (B) and Spry2 protein induction in anti-CD3/CD28-stimulated CD4+ T cells (Day 0, 1, and 3) (n = 3). (C) Immunoblot of Spry2 protein induction and ERK activation in unstimulated and stimulated human CD4+ T cells at indicated time points (24 h and 48 h, respectively); P/I represents phorbol myristate acetate (20 ng/mL) and ionomycin (500 ng/mL) (n = 3). (D) Histogram of p-ERK1/2 levels in CD4+ and CD8+ T cells from Spry2+/+ and Spry2−/− mice stimulated with anti-CD3/CD28 for 24 h. (E) Immunoblot of Spry2 expression in Tn and Tm from B6 mice (n = 2). (F) Graph showing statistical analysis of intracellular IL-2 and IFN-γ in anti-CD3/28-stimulated (24 h) CD4+ T cells from Spry2+/+ and Spry2−/− mice (n = 3). (G) Immunoblot of Spry2 and transcription factor expression in naïve and differentiated CD4+ T cells from C57BL/6 mice (n = 3). (H) Immunoblot of T-bet, GATA3, and RORγT in CD4+ T cells from Spry2+/+ and Spry2−/− mice (n = 2). (I) Graph represents percent intracellular cytokine-positive CD4+ T cells skewed under Th1, Th2, and Th17 conditions from Spry2+/+ and Spry2−/− mice (n = 3). (J) Immunoblot of p-STAT5 and p-STAT6 in CD4+ T cells, treated with IL-2 (10 ng/mL) and TSLP (10 ng/mL) at indicated time points (in min). * in the blot indicates the location of p-STAT6/STAT6 bands. Values are mean ± SEM, significance * p < 0.05; ** p < 0.005 by Student t test (n = 3). All the data of this figure can be found in the S1 and S2 Data files. ERK, extracellular signal-regulated kinase; IL-2, interleukin 2; IFN-γ, interferon gamma; Spl, splenocyte; Spry2, Sprouty2; Thy, thymocyte; Tm, memory CD4+ T cell; Tn, naïve CD4+ T cell; TSLP, thymic stromal lymphopoietin.

