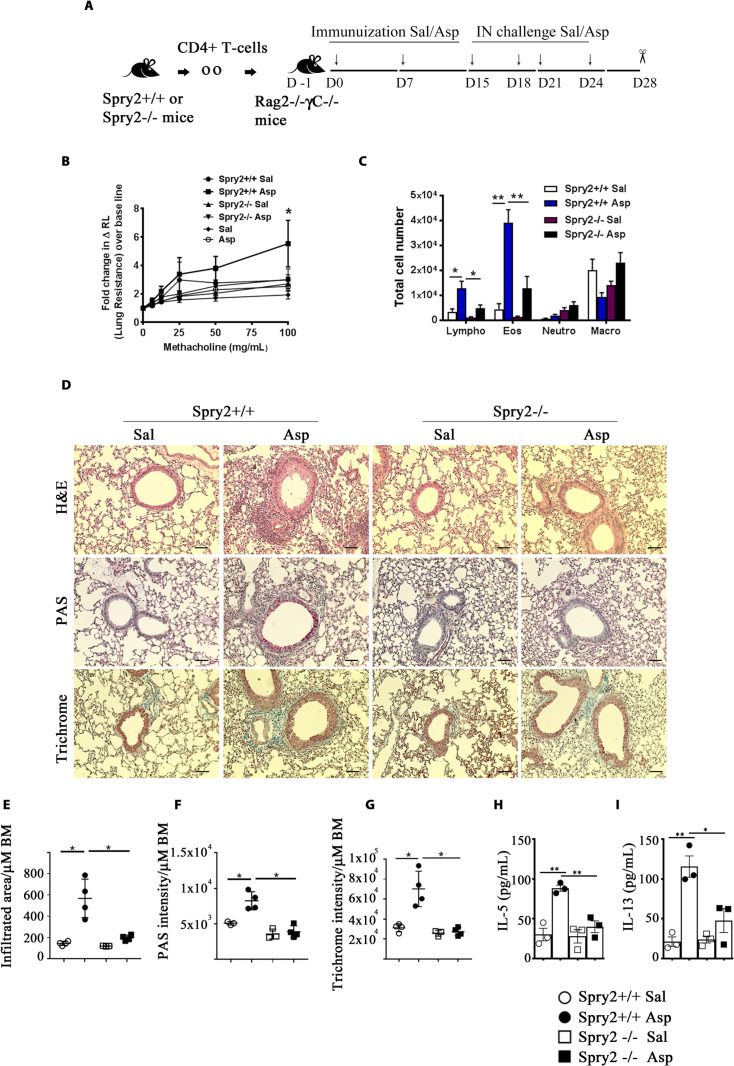
Fig 4. Adoptive transfer of Spry2−/− CD4+ T cells prevents Aspergillus-induced asthma in Rag2−/-γC−/− mice.
(A) Diagram of asthma model for adoptive transfer, immunization, IN challenge, and analysis. (B) AHR to inhaled methacholine as measured by flexiVent. Spry2+/+ Sal and Spry2+/+ Asp represents groups in which CD4+ T cells from Spry2+/+ mice were adoptively transferred to Rag2−/-γC−/− mice and subsequently challenged with Sal or Asp as indicated in (A). Spry2−/− Sal and Spry2−/− Asp represents groups in which CD4+ T cells from Spry2−/− mice were adoptively transferred to Rag2−/-γC−/− mice and challenged with Sal or Asp as indicated in (A). Sal and Asp groups in (B) indicates naïve Rag2−/-γC−/− mice challenged with Sal or Asp. (C) Graph showing total number of Lympho, Macro, Eos, and Neutro in BAL fluid. (D) Representative H&E, PAS, and Trichrome staining from lungs of recipient Rag2−/-γC−/− mice. Scale bar, 100 μm. Lung morphometric analysis of peribronchial and perivascular inflamed area (E), epithelial PAS staining intensity (F), and peribronchial and perivascular trichrome staining intensity (G) per μm of BM. Recipient Rag2−/-γC−/− mice were IN challenged as indicated in (A); IL-5 (H) and IL-13 (I) in BALF were analyzed by ELISA. Data are represented as mean +/− SEM. Significance * p < 0.05; ** p < 0.005 by Student t test. (n = 3 to 4 mice/group). All the data of this figure can be found in the S1 Data file. AHR, airway hyperresponsiveness; Asp, Aspergillus; BAL, bronchoalveolar lavage; BALF, bronchoalveolar lavage fluid; BM, basement membrane; Eos, eosinophils; H&E, hematoxylin and eosin; IN, intranasal; Lympho, lymphocyte; Macro, macrophage; Neutro, neutrophil; PAS, periodic acid–Schiff; Sal, saline.

