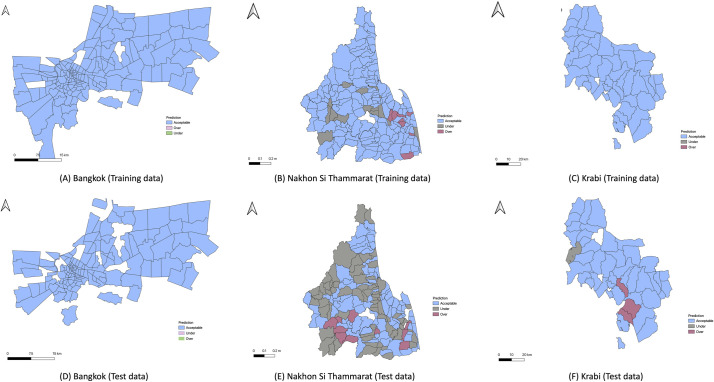
Fig 6. The risk maps of Bangkok, Nakhon Si Thammarat, Krabi for the training (2015–2017), and test (2018) data.
White color represents sub-districts with no data. The choropleth map in this figure was produced using ArcGIS version 10.4 (Esri, Redlands, CA, USA). Source of shapefile: United Nations Office for the Coordination of Humanitarian Affairs https://data.humdata.org/dataset/thailand-administrative-boundaries.

