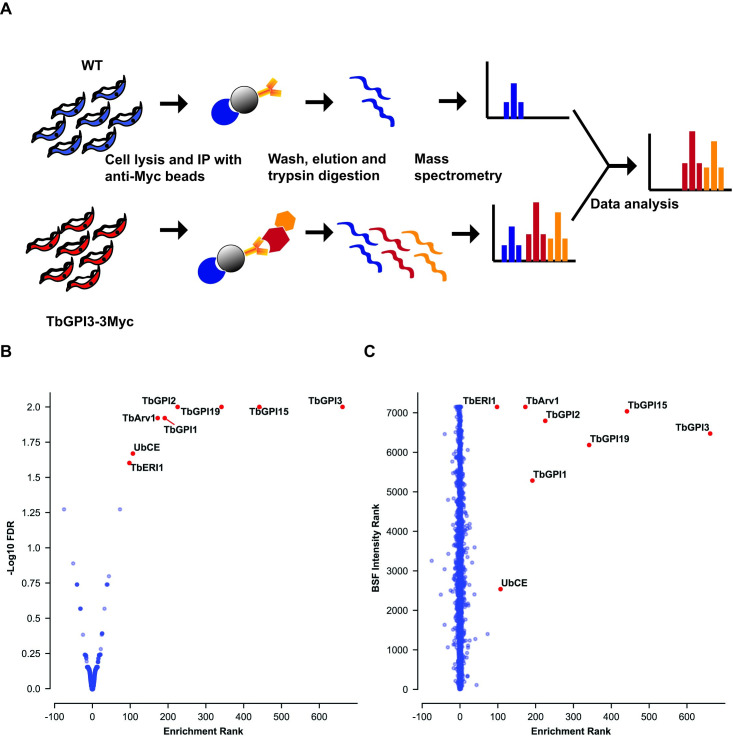
Fig 3. Identification of UDP-GlcNAc: PI α1–6 GlcNAc-transferase subunits by immunoprecipitation of TbGPI3-3Myc from BSF T. brucei digitonin lysates.
(A) Scheme of the label-free proteomics approach to identify TbGPI13-3Myc binding partners. BSF WT and TbGPI13-3Myc expressing cell lines were cultured, harvested and lysed in 0.5% digitonin lysis buffer. Identical quantities of the supernatants were subjected to anti-Myc agarose bead immunoprecipitation and the bound proteins were eluted from the beads with SDS sample buffer. The eluted proteins were reduced, alkylated and digested with trypsin and the resulting peptides analysed by LC-MS/MS. (B) Volcano plot comparing protein groups present in the anti-cMyc immunoprecipitates from TbGPI3-3Myc expressing cell lysates versus WT cell lysates. Mean values (from biological triplicate experiments) for each protein group (dots) are plotted according to their minus log10 False Discovery Rate values (y-axis), calculated by MaxQuant, and the enrichment rank (x-axis). The enrichment rank was computed with the ProtRank algorithm using the iBAQ values calculated by MaxQuant. The higher the rank value on the x-axis, the higher the abundance in the TbGPI3-3Myc samples. The putative subunits of UDP-GlcNAc: PI α1–6 GlcNAc-transferase in T. brucei are highlighted in red and annotated with their corresponding names (Table 1). (C) Relative intensity plot using a new algorithm. The same data as (B) are plotted with a different y-axis, whereby each protein group is assigned an intensity rank from the most abundant protein group (1) to least abundant protein groups (7148) based on their summed eXtracted Ion Currents (XICs) for the total BSF proteome. (Details of the mass spectrometry and data analysis are provided in in Materials and Methods).

