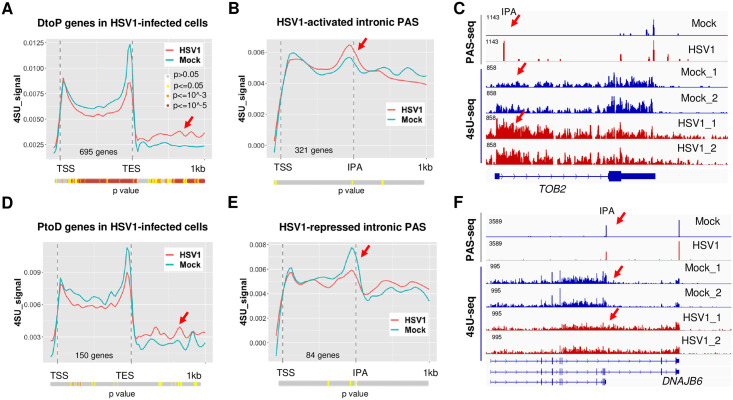
Fig 2. HSV-1-induced APA changes occur, at least in part, co-transcriptionally.
(A) 4sU-seq signals of genes that displayed DtoP APA shifts in HSV-1-infected HeLa cells (8 hpi). TSS: transcription start site. TES: transcription end site. P values for the difference between the 4sU-seq signals at each position in mock and HSV1-infected cells were calculated using Wilcoxon rank sum test and plotted as a color-coded bar below the plot. The color scheme is shown in the inset. (B) 4sU-seq signals at genes that displayed DtoP APA shifts in HSV-1 infected cells involving intronic PAS. IPA: intronic polyadenylation site. (C) PAS-seq and 4sU-seq tracks of TOB2. Red arrows point to the IPA region. (D) 4sU-seq signals at genes that displayed PtoD APA shifts in HSV-1 infected cells. (E) 4sU-seq signals at genes that displayed PtoD APA shifts in HSV-1 infected cells involving intronic PAS. (F) PAS-seq and 4sU-seq tracks of DNAJB6.

