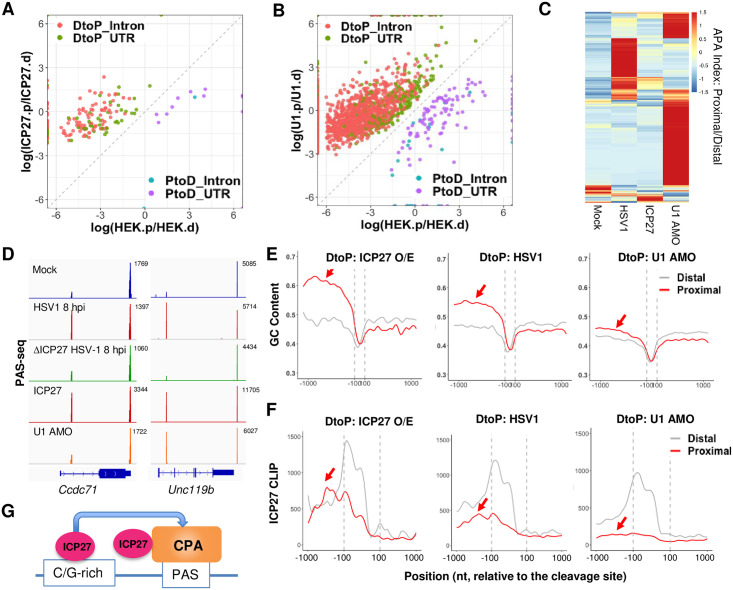
Fig 4. Mechanism of HSV-1-mediated APA regulation.
(A) A scatter plot showing the significant APA changes induced by ICP27 over-expression in HEK293 cells. Color scheme and labeling are similar to Fig 1A. (B) A scatter plot showing the significant APA changes induced by U1 antisense morpholino oligo (AMO)-treatment of HEK293 cells. (C) A heat map of APA index of all genes that displayed significant APA changes induced by HSV-1-infection, ICP27 over-expression, or U1 AMO. Data was scaled by row. (D) PAS-seq tracks for two example genes. (E) GC content at the proximal and distal PAS of genes that displayed significant DtoP shifts induced by ICP27 over-expression (O/E), HSV-1 infection (HSV1), or U1 AMO treatment. (F) ICP27 CLIP signals at the proximal and distal PAS of genes that displayed significant DtoP shifts induced by ICP27 over-expression (O/E), HSV-1 infection (HSV1), or U1 AMO treatment.

