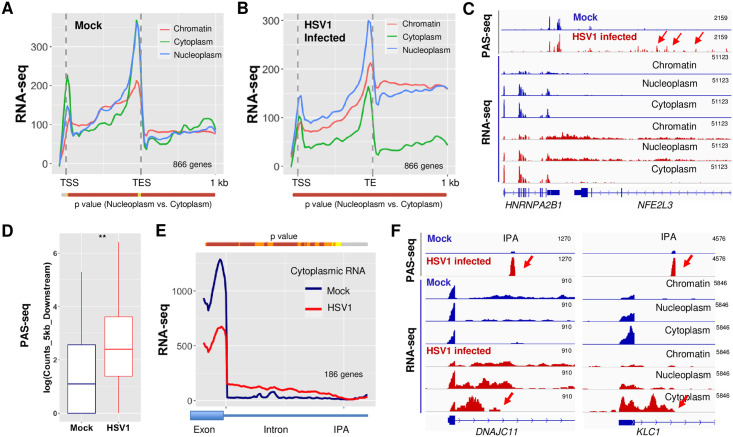
Fig 5. HSV-1-mediated APA regulation and mRNA export.
Average RNA-seq signals for genes that display significant HSV-1-induced APA changes in chromatin, nucleoplasm, and cytoplasm fractions in mock-infected (A) or HSV-1-infected human fibroblast cells (B). P values for the difference in RNA-seq signals at each position between the nuclear and cytoplasmic fractions were calculated using Wilcoxon rank sum test and plotted as a color-coded bar below the plot. The color scheme is the same as Fig 2A. (C) PAS-seq and RNA-seq tracks for HNRNPA2B1 gene. Red arrow points to the PAS-seq signals downstream of the normal TES. (D) PAS-seq signals in the 5kb region downstream of the normal TES in mock- and HSV-1-infected cells. **:P value < 0.05, Wilcox test. (E) Cytoplasmic RNA-seq signals for HSV-1-induced DtoP_intron APA changes. IPA: intronic poly(A) site. (F) PAS-seq and RNA-seq tracks for two example genes. Red arrows point to the IPA.

