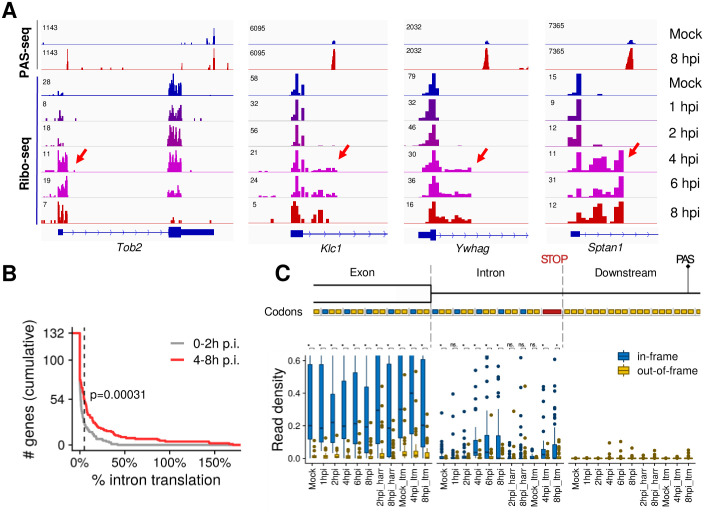
Fig 6. HSV-1-induced intronically polyadenylated APA isoforms are translated.
(A) PAS-seq and Ribo-seq tracks for four example genes. Ribo-seq signals within intronic regions are marked by red arrows. (B) Cumulative distribution of the percentage of intronic Ribo-seq read densities (normalized reads per codon) compared to the level in the upstream exon. The dashed line indicates genes exceeding the 5% threshold mentioned in the text. The P value for comparing the pooled read densities in un-infected through 2 hpi vs. 4–8 hpi is shown (two-sided Kolmogorov-Smirnov test) (C) Boxplots showing the distributions of read densities for the 54 genes exceeding the 5% threshold stratified by time point after infection, location with respect to exon-intron boundary and first intronic stop codon, and reading frame of translation. The hinges and whiskers correspond to quartiles and to the most extreme values outside of 1.5 times the inter-quartile range, respectively. The median and outliers are indicated. The y axis is arbitrarily cut at 0.6. P values for comparisons of in-frame and out-of-frame codons are indicated (***, p<0.001; **, p<0.01; *, p<0.05; n.s., not significant at 5% level).

