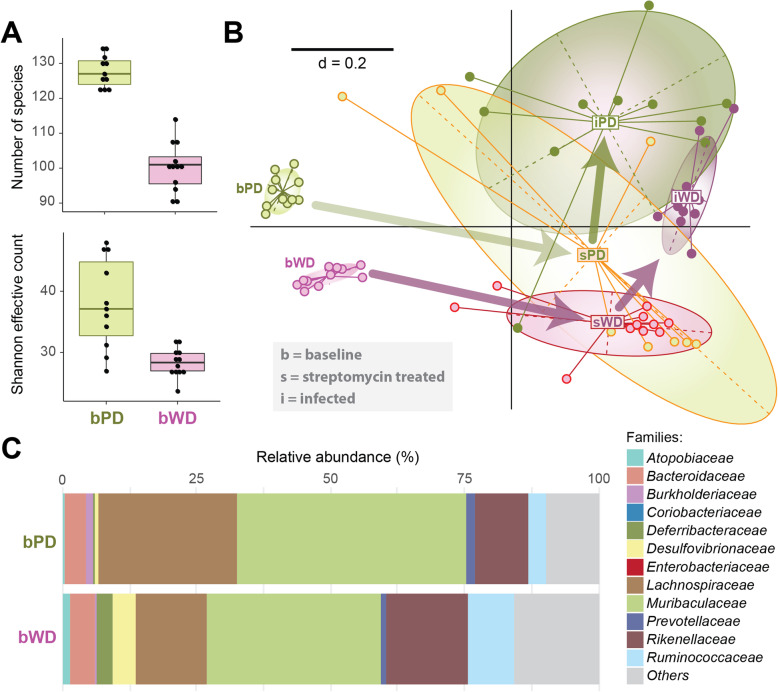
Fig. 1.
Differences in the fecal microbiota diversity and composition in to dietary mice groups. a Changes in α-diversity are shown as boxplots. All differences between two samples are significant (p ≤ 0.05) according to the pairwise Wilcoxon Rank Sum Test (n of WD fed mice = 12, n of PD fed mice = 11). b β-diversity analysis displayed as a nonmetric multidimensional scaling plot (metaNMDS) computed from generalized UniFrac distances, which were calculated from normalized OTU tables and phylogenetic distance trees (n of WD fed, untreated mice = 12, n of WD fed, streptomycin-treated/infected mice = 11, n of PD fed, untreated/infected mice = 11, n of PD fed, streptomycin-treated mice = 8). c An overview of relative abundances of major bacterial families is given by stacked bar plots. Cumulative abundances were calculated from all single OTUs classified within one family as per the best possible taxonomy using both the RDP and Silva. N of WD fed mice = 12, n of PD fed mice = 11

