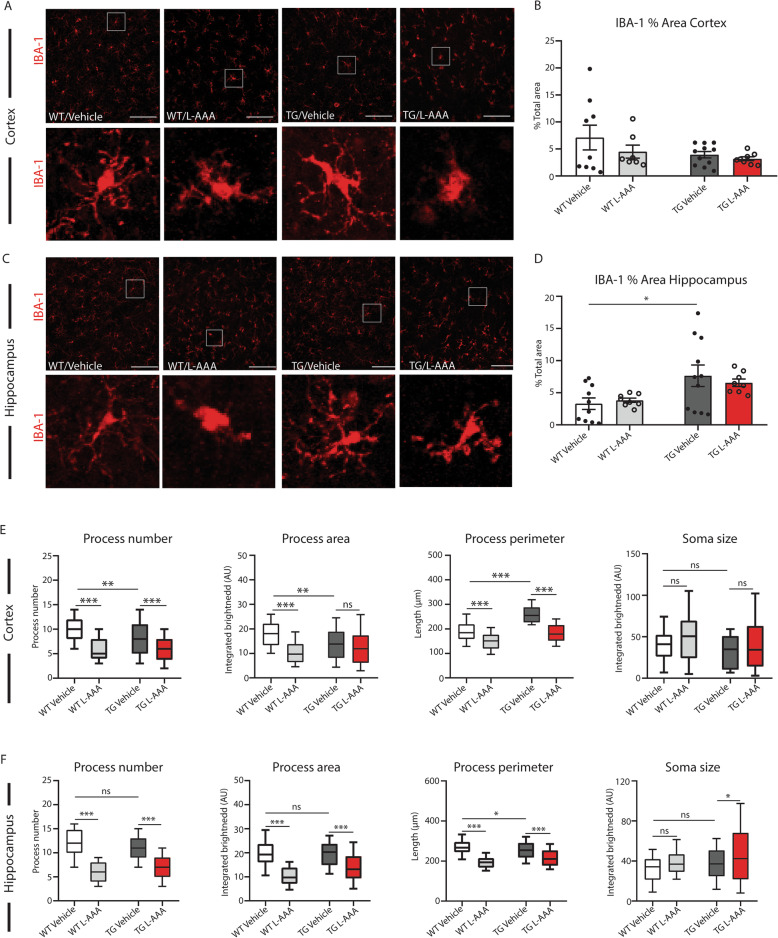
Fig. 2.
L-AAA treatment affects the morphology of microglia in the cortex and hippocampus. a Representative images and b quantification of the % area of Iba-1 staining in cortex of WT and 5XFAD OBCSs treated with L-AAA for 24h (n=7–9). c Representative images and d quantification of the % area of Iba-1 staining in hippocampus of WT and 5XFAD OBCSs treated with L-AAA for 24 h. Scale bar=100 μM (n=8-11). e Analysis of process number, process area, process perimeter, and soma size of Iba-1-positive microglia in the cortex (e) and hippocampus (f) (n=7–11). Values shown in graphs represent the mean value ± SEM. Statistical analysis included a one-way ANOVA, *P<0.05; **P<0.01; ***P<0.001

