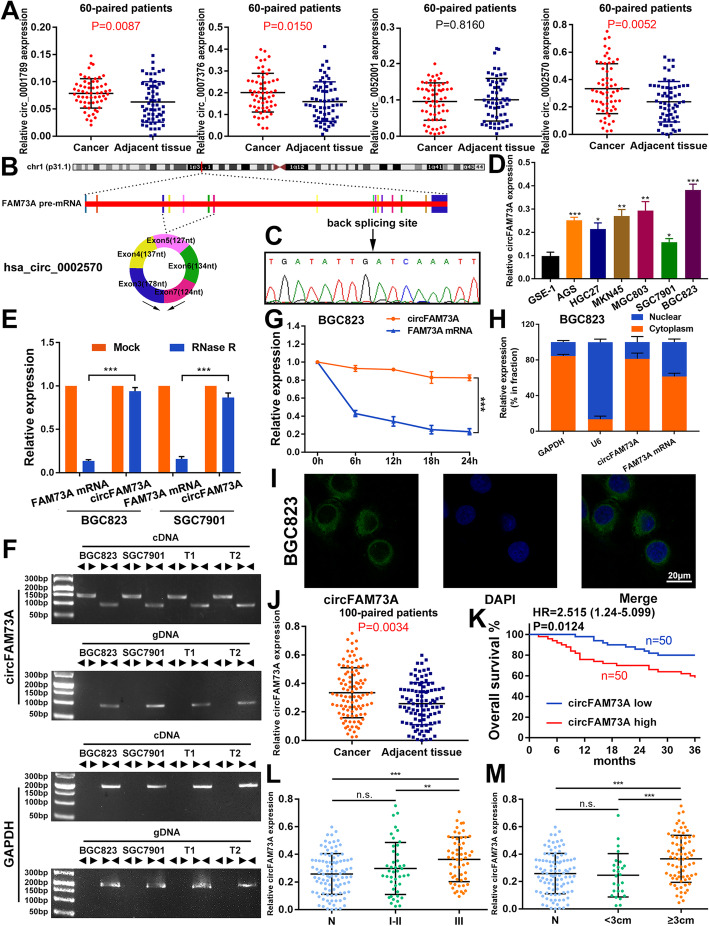
Fig. 1.
CircFAM73A is upregulated in GC and high circFAM73A predicts poor prognosis. a Validated the expression of hsa_circ_0001789, hsa_circ_0007376, hsa_circ_0052001 and hsa_circ_0002570 in the 60 paired GC and adjacent tissues by qRT-PCR. b Schematic drawing illustrating circFAM73A (hsa_circ_0002570) (700 bp) arose from exon 3,4,5,6,7 of the FAM73A gene. c Arrow represents the “head-to-tail” splicing sites of circFAM73A confirmed by Sanger sequencing. d Relative circFAM73A expression in 6 GC cell lines relative to normal human gastric epithelial cell line GES-1. e qRT-PCR analysis of the level of circFAM73A and linear FAM73A mRNA after treatment with RNase R in BGC823 and SGC7901 (normalized to mock treatment). f The existence of circFAM73A was validated in BGC823 and SGC7901 and two GC samples (T1 and T2) by RT-PCR. Divergent primers amplified circFAM73A from cDNA, but not from genomic DNA (gDNA). GAPDH was used as a negative control. g Relative levels of circFAM73A and FAM73A mRNA were measured by qRT-PCR in BGC823 treated with Actinomycin D for different periods of time. h Relative levels of GAPDH (positive control for cytoplasmic fraction), U6 (positive control for nuclear fraction), circFAM73A, and FAM73A mRNA from nuclear and cytoplasmic fractions in BGC823. i Fluorescence in situ hybridization (FISH) was conducted to determine the subcellular localization of circFAM73A in BGC823. DAPI was used for nuclei staining. Scale bar: 20 μm. j Relative circFAM73A expression in additional 100 paired GC and adjacent tissues. k Overall survival analysis based on circFAM73A expression in 100 GC patients. The median circFAM73A expression is used as a cutoff. l The association of circFAM73A expression and TMN stage through qRT-PCR. m The association of circFAM73A expression and tumor size through qRT-PCR. Graph represents mean ± SD; *p < 0.05, **p < 0.01, and ***p < 0.001

