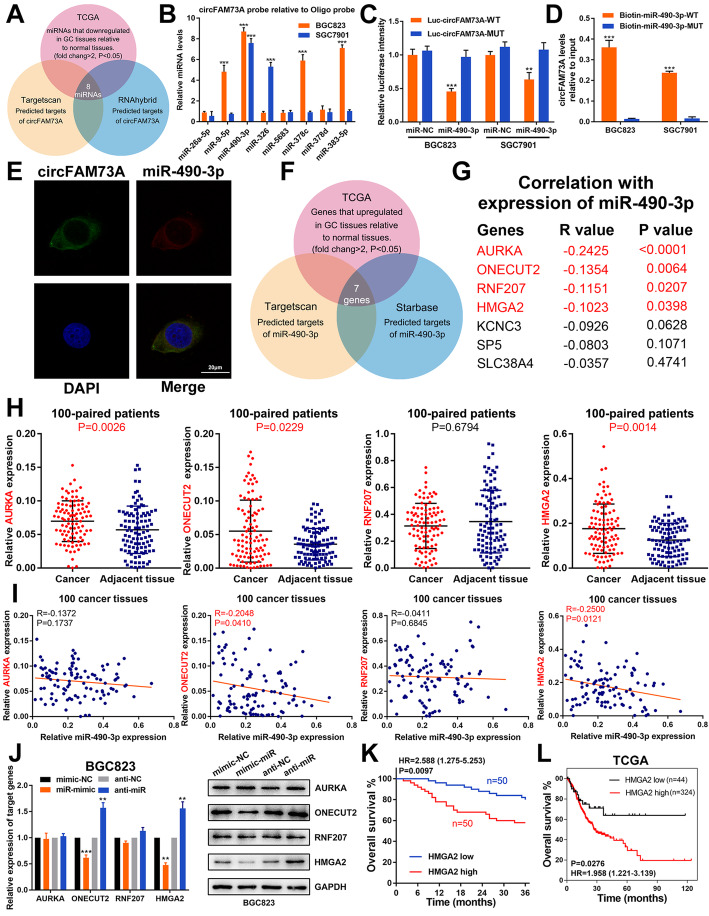
Fig. 4.
CircFAM73A acts as a sponge of miR-490-3p, HMGA2 is the direct downstream target of miR-490-3p. a Venn diagram showing the overlap of target miRNAs of circFAM73A predicted by TargetScan and RNAhybrid and downregulated miRNAs in GC from TCGA. b The expression levels of 8 miRNAs candidate miRNAs were quantified by qRT-PCR after pull-down with biotin-labeled circFAM73A probe in BGC823 and SGC7901 cells. c Luciferase intensity in BGC823 and SGC7901 cells co-transfected with luciferase reporter containing with wild-type or mutated circFAM73A-miR-490-3p binding sequences and the mimics of miR-490-3p or control. d The expression levels of circFAM73A were tested by qRT-PCR after pull-down with biotin-labeled wild-type or mutant miR-490-3p in circFAM73A overexpressed BGC823 and SGC7901 cells. e Fluorescence in situ hybridization assay revealed the co-location between circFAM73A and miR-490-3p in cytoplasm. Scare bar = 20 μm. f Venn diagram detailing the exploration of miR-490-3p downstream targets. g The correlation between miR-490-3p and the 7 potential targets gene in TCGA database. h The mRNA expression of AURKA, ONECUT2, RNF207, and HMGA2 in 100 paired GC and adjacent tissues were determined by qRT-PCR. i Correlation between miR-490-3p and AURKA, ONECUT2, RNF207, and HMGA2 according to our GC samples. j The expression of AURKA, ONECUT2, RNF207, and HMGA2 after miR-490-3p alternation in BGC823 cells measured by qRT-PCR and Western Blot. k Overall survival analysis based on HMGA2 expression in 100 GC patients. The median HMGA2 expression is used as a cutoff. l Overall survival analysis based on HMGA2 expression in TCGA GC patients. The optimal cut-off was calculated by X-tile software. Graph represents mean ± SD; *p < 0.05, **p < 0.01, ***p < 0.001

