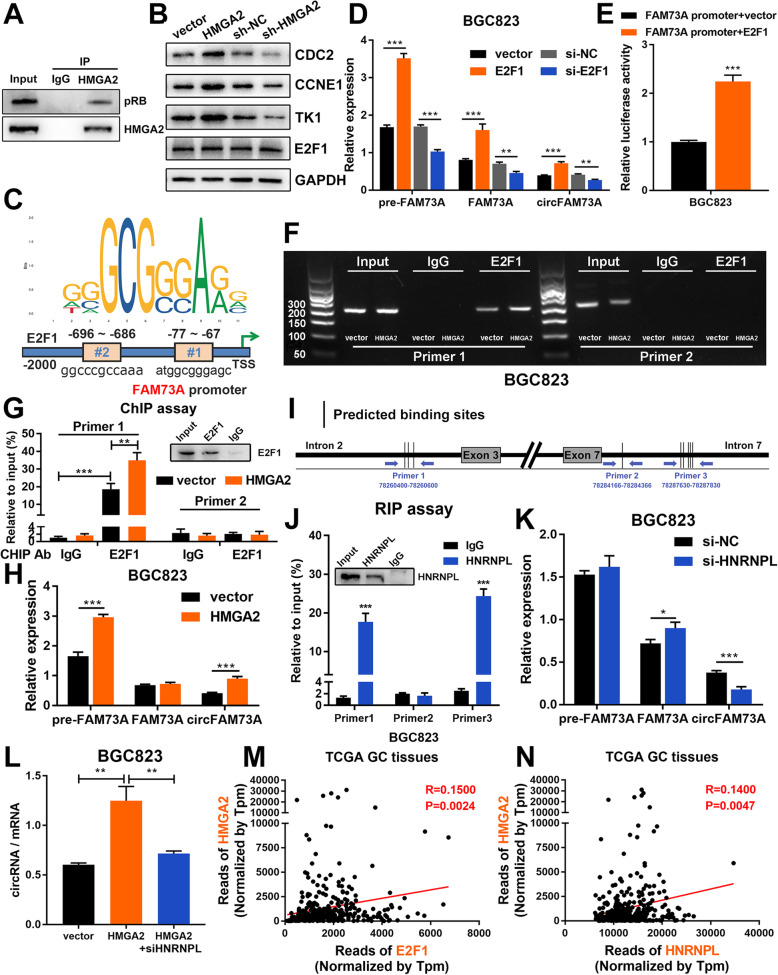
Fig. 8.
HMGA2 elevates circFAM73A expression reciprocally by E2F1 and HNRNPL. a Co-immunoprecipitation was performed using control IgG or HMGA2 antibody. Immunoprecipitated proteins were detected by pRB and HMGA2 antibodies. b Western blot of E2F1 and classical E2F1 responsive effectors (CCNE1, TK1, and CDC2) in BGC823. c Putative binding sites of E2F1 in FAM73A promoter region predicted by JASPAR. d Relative expression of pre-FAM73A, FAM73A mRNA, and circFAM73A with E2F1 alteration were measured by qRT-PCR in BGC823. e Luciferase reporter assay analysis of FAM73A promoter luciferase reporters in BGC823 cells transfected with E2F1 or control. f RT-PCR was performed in BGC823 cells after chromatin immunoprecipitation by E2F1 antibody or control IgG and by two pairs of primers to validate the E2F1 binding sites in FAM73A promoter region. g qRT-PCR analysis of chromatin immunoprecipitation assay in E. h Relative expression of pre-FAM73A, FAM73A mRNA, and circFAM73A in BGC823 with HMGA2 reconstitution were measured by qRT-PCR. i Schematic diagram demonstrated three designed specific primers covering different binding site sequences in intron-2 and intron-7. j Relative enrichment of amplification sequence by three indicated primes after RNA binding protein immunoprecipitation assay by HNRNPL antibody or control IgG in BGC823. k Relative expression of pre-FAM73A, FAM73A mRNA, and circFAM73A in BGC823 with HNRNPL suppression were measured by qRT-PCR. l The ratio of circFAM73A expression to FAM73A mRNA expression in BGC823. m Correlation between E2F1 and HMGA2 according to TCGA statistics. n Correlation between HNRNPL and HMGA2 according to TCGA statistics. Graph represents mean ± SD; *p < 0.05, **p < 0.01, ***p < 0.001

