Fig. 1.
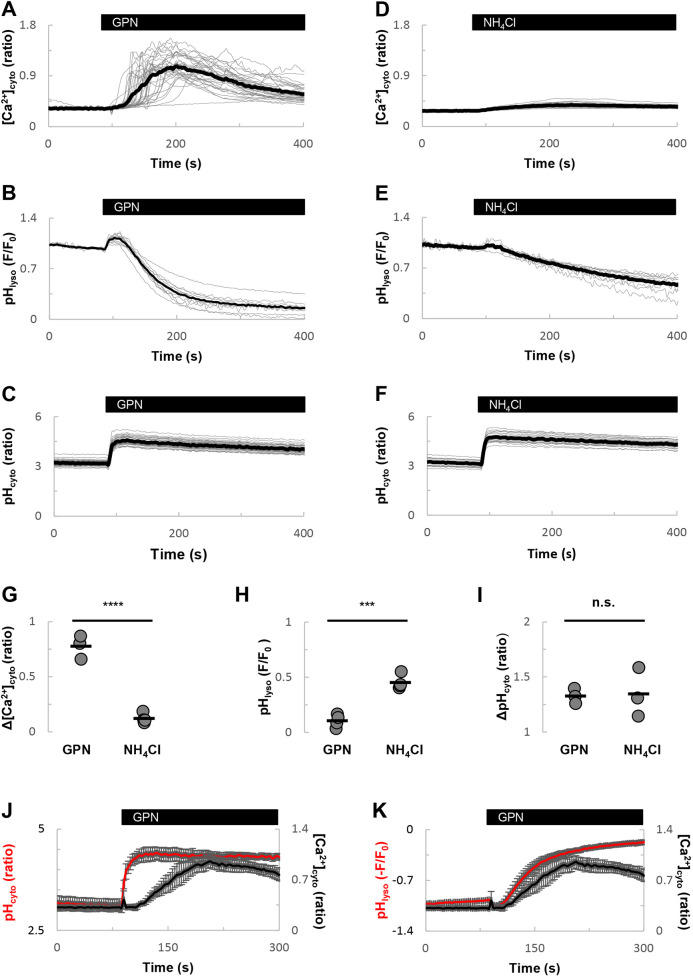
GPN and NH4Cl differentially affect cytoplasmic Ca2+ and pH. (A-C) Effects of GPN (200 µM) on cytosolic Ca2+ (A), lysosomal pH (B) and cytosolic pH (C) in fibroblasts. Time courses were obtained from cells loaded with Fura-2, LysoTracker Red and BCECF, respectively. Data are expressed as the indicated fluorescence ratio (for Ca2+ or cytosolic pH) or fluorescence (F) relative to initial fluorescence (F0) for LysoTracker Red. Grey traces represent recordings for all individual cells from a typical field of view. Black traces represent the population average. An increase in Fura-2 and BCECF ratios corresponds to an increase in cytosolic Ca2+ and pH, respectively. A decrease in LysoTracker Red fluorescence corresponds to an increase in lysosomal pH. (D-F) Similar to A-C, except cells were stimulated with NH4Cl (5 mM). (G-I) Summary data quantifying effects of GPN and NH4Cl on cytosolic Ca2+ (G), lysosomal pH (H) and cytosolic pH (I). Each point represents the average of all labelled cells in a field of view from an independent experiment (n=3-4). ***P<0.001; ****P<0.0001; n.s., not statistically significant (independent-samples t-tests). (J,K) Comparison of the effects of GPN on Ca2+ relative to changes in cytosolic (J) and lysosomal (K) pH. Data are mean±s.e.m. from 3-4 independent experiments.

