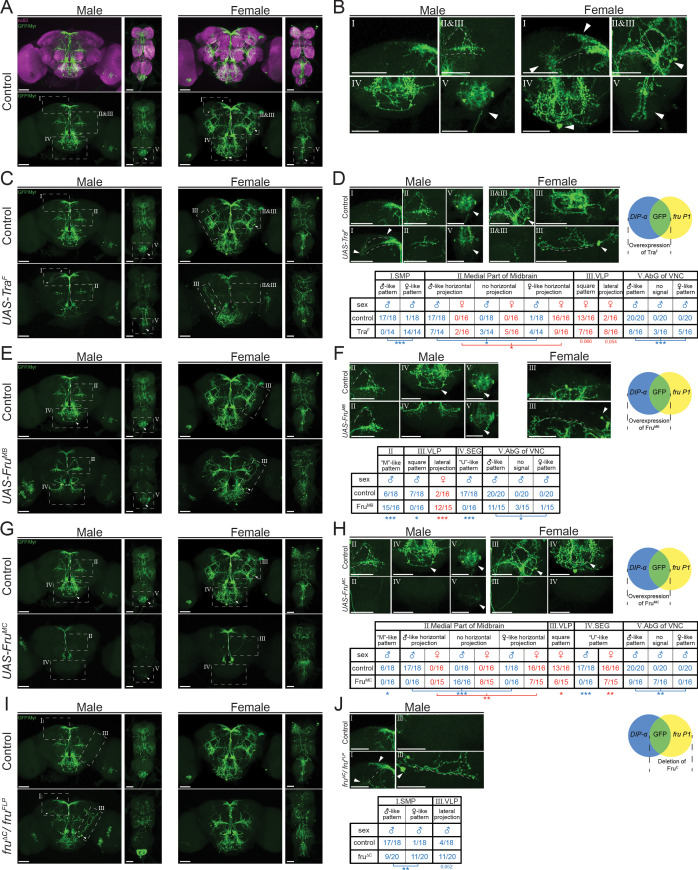
Figure 9. Higher resolution analyses of fru P1 ∩ DIP-α neurons with sex hierarchy perturbations.
Confocal maximum intensity projections of brains and ventral nerve cords from 4- to 7-day-old adult flies. fru P1 ∩ DIP-α neurons are in green (rabbit α-GFP Alexa Flour 488). Staining with the α-nc82 neuropil maker shows brain morphology in magenta (mouse α-nc82, goat α-mouse Alexa Flour 633). Image data were captured with ×20 objective, with scale bars showing 50 µM (A-J). Higher magnification images were generated using the Zeiss Zen software package (B, D, F, H, and J). Roman numerals are consistent across the panels in the same row. Venn diagrams show where membrane-bound GFP and sex hierarchy transgenes are expressed. (A) fru P1 ∩ DIP-α expression patterns in males and females. (B) Computationally magnified images, with sexually dimorphic regions indicated. Subpanels show: [I] superior medial protocerebrum (SMP) region of the brain; [II and III] medial part of midbrain region, where there are horizontal projections, and the ‘M’-like pattern (more frequent in males). The square pattern (more frequent in females) is in the ventral lateral protocerebrum (VLP) region of the brain. The medial horizontal projection is in a more exterior section of the confocal stack then the other features [II and III]; [IV] Subesophageal ganglion region of the brain (SEG). The U-like pattern and a set of cell bodies more frequently found in females are shown; [V] The abdominal ganglion of the ventral nerve cord (AbG). (C-J) Examination of morphology of fru P1 ∩ DIP-α neurons when sex hierarchy transgenes are expressed in DIP-α neurons. The quantification and statistics are provided in a table within the subpanel on the right of each row. This figure only shows regions that had significant changes due to sex hierarchy perturbation (full dataset provided; Source data 4). (C-D) TraF overexpression in DIP-α neurons. [III] a lateral projection in females that is not shown in wild-type data in panel B. (E-F) FruMB overexpression in DIP-α neurons. (G-H) FruMC overexpression in DIP-α neurons, (I-J) FruC isoform deletion. FruMC is absent or highly reduced in fru P1 neurons in this genotype, as transheterozygous for fruFLP/ fruΔC. Statistical significance of the differences in morphological features, between same sex control and genotypes with sex hierarchy transgene expression are indicated. Comparisons were done using the Fisher’s exact test (*p<0.05, **p<0.005, ***p<0.0005). The morphological features with significant differences are indicated by lines below the table (male in blue and female in red). n > 15 for each category. The genotypes of the samples shown are: DIP-αGal4; UAS>stop>GFP.Myr/+; fruFLP/+ (A-B), DIP- αGal4; UAS>stop>GFP.Myr/ UAS-TraF; fruFLP/+ (C-D), DIP- αGal4; UAS>stop>GFP.Myr/ UAS-FruMB; fruFLP/+ (E-F), DIP- αGal4; UAS>stop>GFP.Myr/ UAS-FruMC; fruFLP/+ (G-H), DIP- αGal4; UAS>stop>GFP.Myr/+; fruFLP/ fruΔC (I-J). Brain region nomenclature are consistent with previous reports (Insect Brain Name Working Group et al., 2014).


