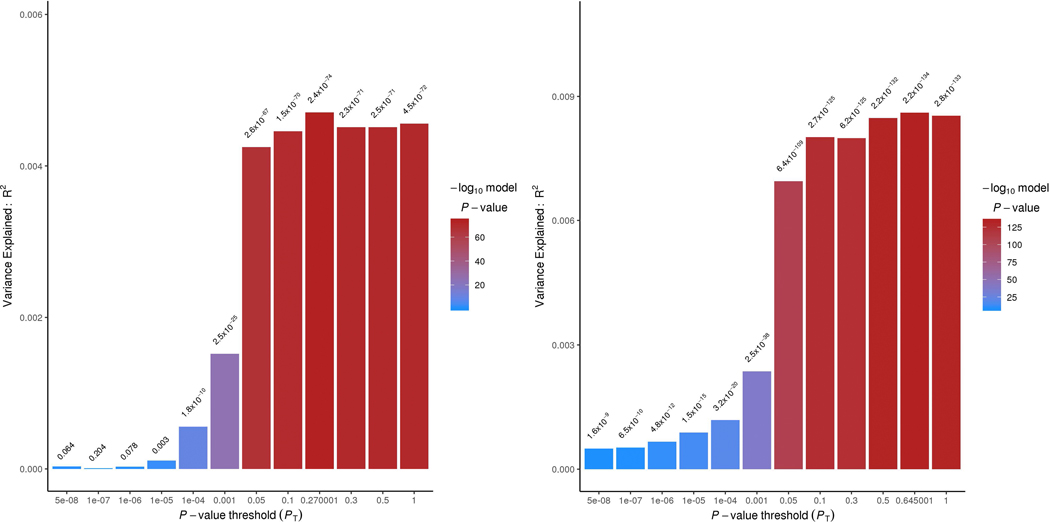
Extended Data Fig. 2. Polygenic risk scores in MVP and PGC-PTSD.
Polygenic risk score (PRS) from MVP EUR case-control (left) and EUR PCL-total (right) applied to PGC-PTSD13 case-control phenotype with varying P-value thresholds (PT) on the x-axis and explained variance (R2) on the y-axis. The approximate estimate of the explained variance was calculated using a multivariate regression model. P values reported are two sided, and Bonferroni correction accounting for the number of P-value thresholds tested is P = 2.38 × 10⁻⁴.

