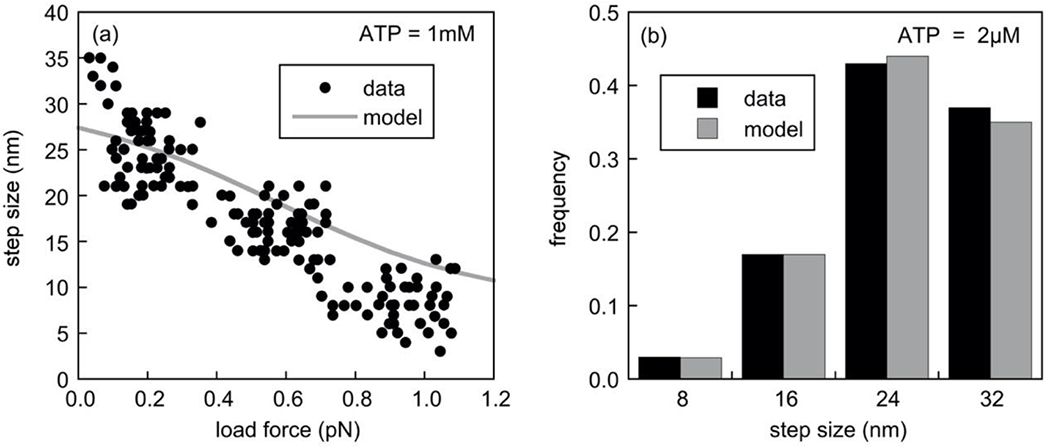
Fig. 3. Dynein stepping behavior under various applied loads.

In panel (a), we compare the experimentally obtained step sizes versus load force [24] (circles) with the average step sizes obtained with our model at an ATP concentration of 1mM (solid grey line). The normalized load force in [24] is renormalized here to a stall force of 1.2pN, which is the stall force of our model at this ATP concentration. As only steps in the minus direction (the preferred direction of the dynein motor) were analyzed in the experiments, we used Eq.7 for these simulations. Data points were extracted from the published paper using the GraphClick software package [30]. As in the experimental data, the motor in the model takes predominantly large steps of 32nm and 24nm at low load and predominantly small steps of 8nm at high load, though the quantitative agreement for larger forces is not as good as for small forces. In panel (b), we compare the predicted distribution (grey bars) of the absolute step sizes (positive and negative) at a low ATP concentration (2μM) with published data for this ATP concentration [5] (black bars).
