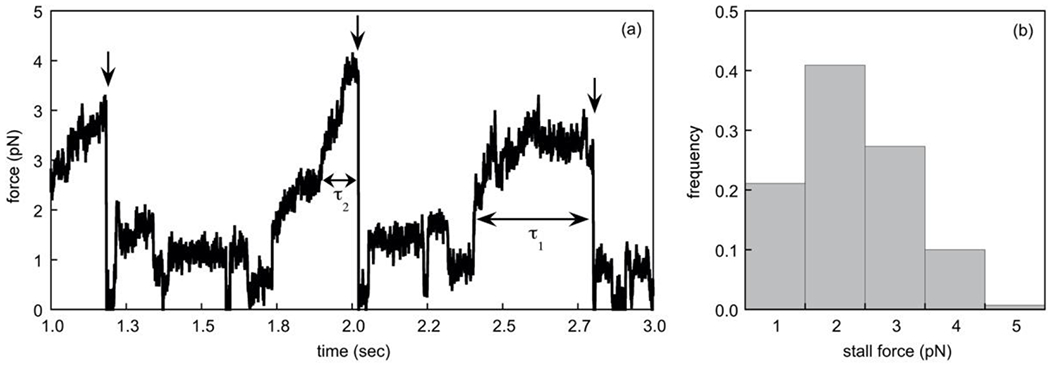
Fig. 5. Measurement of dynein stall times.

(a) We show a simulated time course of the force exerted by an optical trap on a cargo driven by a single dynein motor at 1mM ATP. Three stalling events are shown (indicated by the vertical arrows). The horizontal double-sided arrows mark the stall times for two of these events (τ1 and τ2). The precipitous drop in force after each stall reflects the detachment of the motor. In our simulations, the motor instantaneously re-attached to the track after detachment. (b) We show the distribution of stall forces obtained from 1000 detachment events as characterized in (a).
