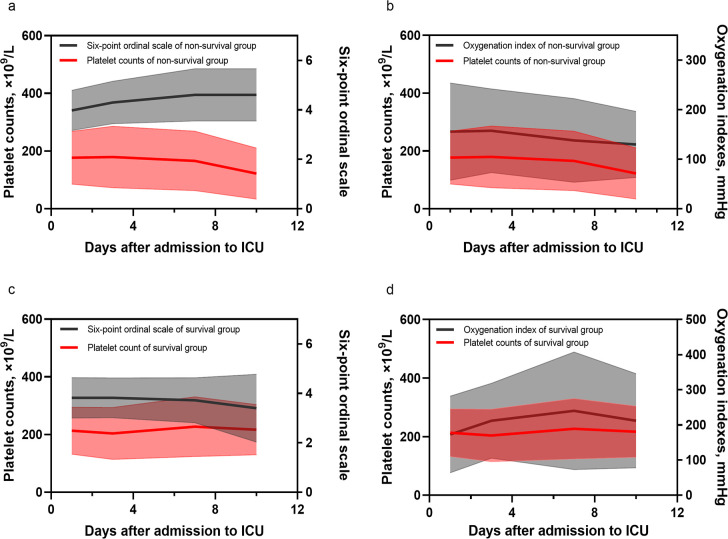
Fig 1. Time curves of platelet count, six-point ordinal scale score and oxygenation index.
Shaded areas show the standard error while the curves show the means of platelet count, six-point ordinal scale and oxygenation index. a. Time curve of platelet count and oxygenation index of non-survival group. b. Time curve of platelet count and six-point ordinal scale of non-survival group. c. Time curve of platelet count and oxygenation index of survival group. d. Time curve of platelet count and six-point ordinal scale of survival group.

