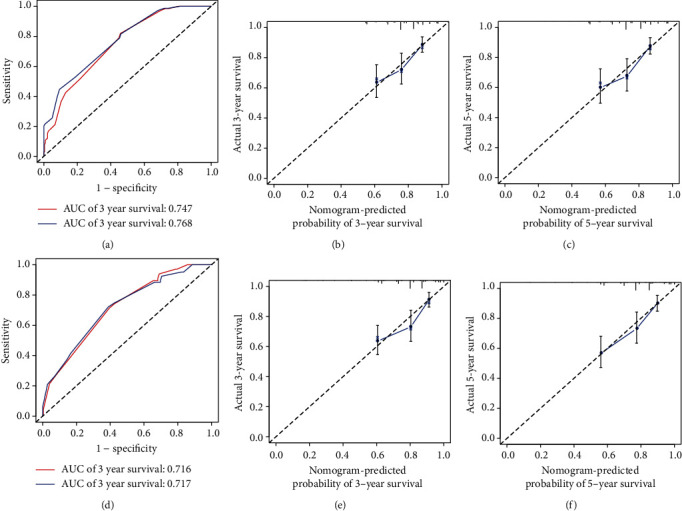
Figure 4.

ROC curves and calibration plots of the nomogram in training and validation cohorts. (a) ROC curves for discrimination in the training set. (b) Calibration plot of observed and predicted probabilities for the nomogram in the 3-year training set. (c) Calibration plot of observed and predicted probabilities for the nomogram in the 5-year training set. (d) ROC curves for discrimination in the validation set. (e) Calibration plot of observed and predicted probabilities for the nomogram in the 3-year validation set. (f) Calibration plot of observed and predicted probabilities for the nomogram in the 5-year validation set.
