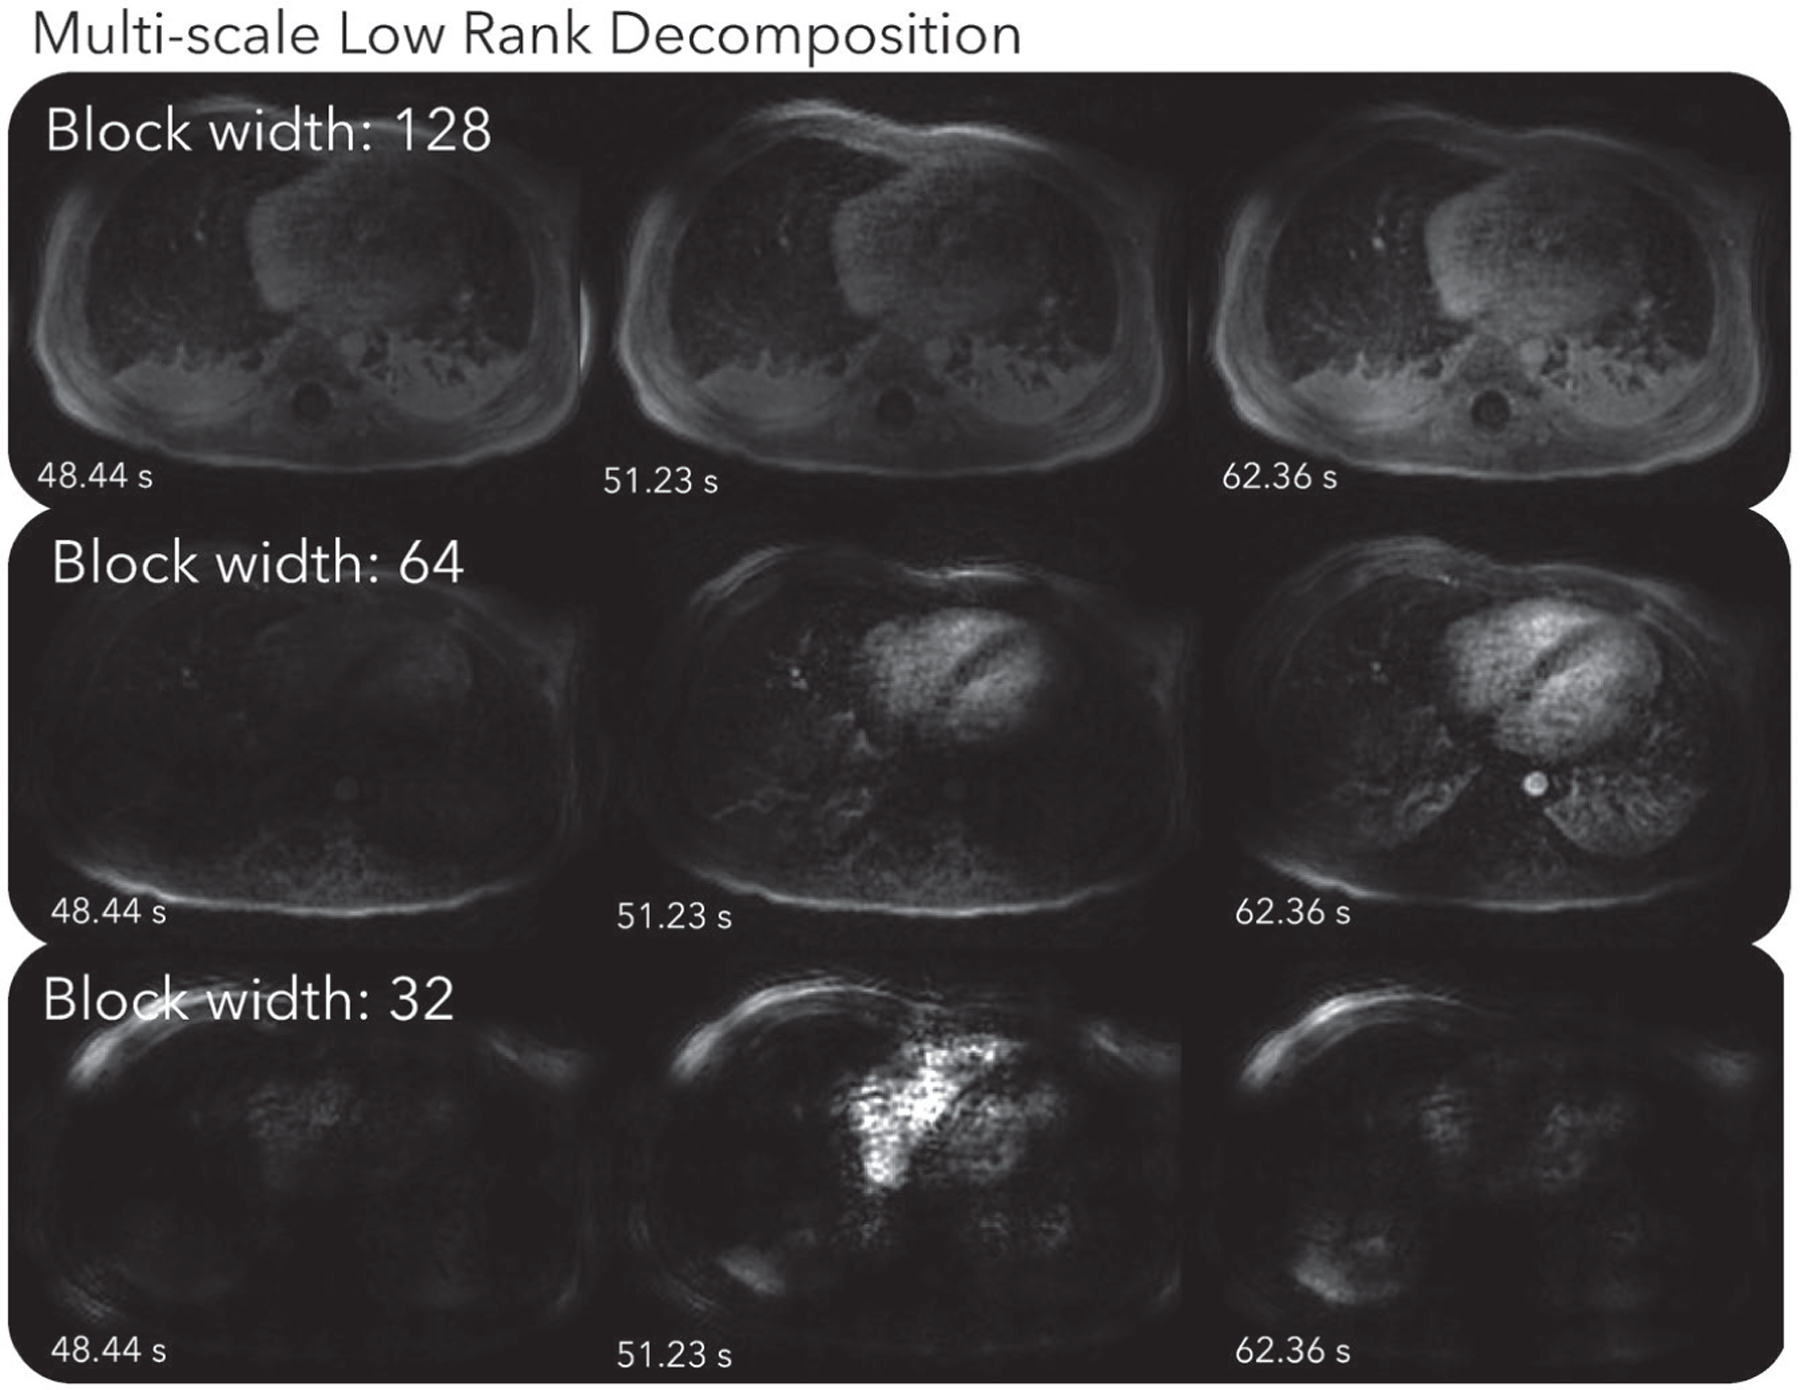
FIGURE 3.

MSLR decomposition of the first DCE dataset. Dynamics can be seen more clearly in Supporting Information Video S5. The scale with the 1283-sized blocks mostly shows static background tissues. The scale with the 643-sized blocks depicts mostly contrast enhancements in the heart and aorta, and respiratory motion. The scale with 323-sized blocks displays spatially localized dynamics, such as those in the right ventricle, and oscillates more over time than other scales
