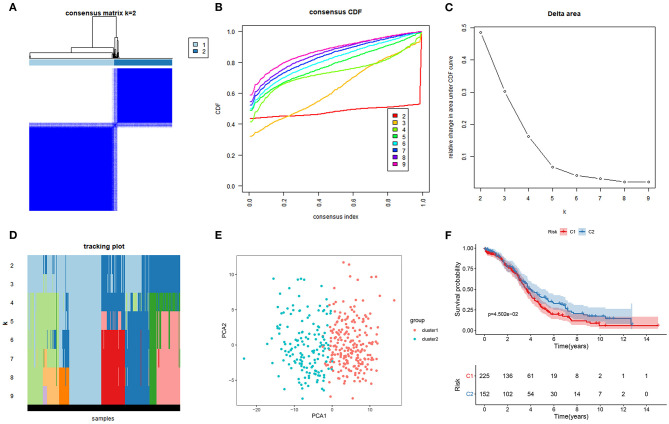
Figure 1.
Characterization of two molecular subtypes based on ferroptosis-related mRNAs in ovarian cancer. (A) Consensus matrix when k = 2. Both the rows and columns of the matrix represent samples. From white to dark blue, the value of the consistency matrix is from 0 to 1. (B) Consensus CDF, (C) Delta area, and (D) tracking plot for validation of the clustering results. (E) PCA plots for validation of the stability and reliability of the classification. (F) Kaplan-Meier OS curves for ovarian cancer patients between C1 and C2 subtypes.

