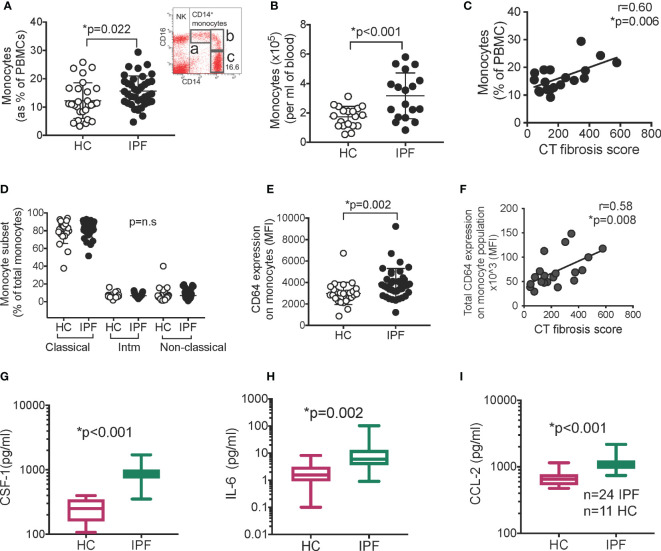
Figure 1.
Monocytes and serum CSF-1, IL-6, and CCL-2 are raised in IPF. (A) Monocytes levels in IPF (n=37) vs healthy controls/HC (n=28) as % of PBMC. Inset- gating for monocytes. FACS plot was gated on all live PBMCs. “a”- non-classical monocytes, “b” –intermediate monocytes, “c” – classical monocytes; “NK” – natural killer cells (B) Monocytes as absolute number in blood (n=18). (C) Monocyte levels against amount of lung fibrosis on contemporaneous thoracic CT scans (D) Monocyte subsets in IPF and HC “Intm” – intermediate. Populations shown in (A). (E, F) Expression of CD64 (n=37) determined by flow cytometry; and correlation between CD64 expression on monocytes and CT fibrosis score (n=19). p values derived using Student t test for normally distributed data, or Mann Whitney Rank Sum test if not normally distributed. Correlation analyzed using Pearson correlation test. (G–I) Levels of CSF-1, IL-6, and CCL-2 in serum measured with Luminex technology (n=24 IPF; n=11 healthy controls, HC). Y axis in for (G–I) is expressed as log 10. Box plot is median+/1 interquartile confidence interval, whiskers show minimum and maximum values. p values calculated using Mann Whitney Rank Sum test for (G–I).

