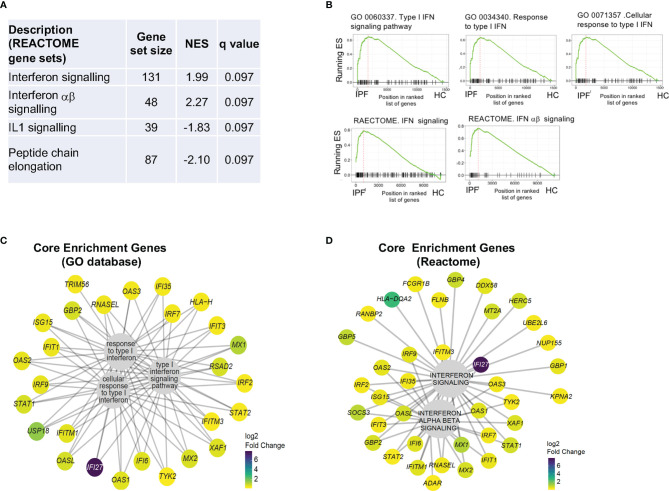
Figure 2.
RNA sequencing of IPF monocytes reveals a Type I IFN signaling signature. (A) Analysis of differentially expressed gene list for enrichment of biologically-relevant pathway and processes using REACTOME gene sets. NES – normalized enrichment score. (B) GSEA plots showing most enriched gene sets from GO and REACTOME database. ES- Enrichment score. (C, D) Composition and expression levels of genes in the leading edge of the five gene sets from (B) expressed as log2 fold change.

