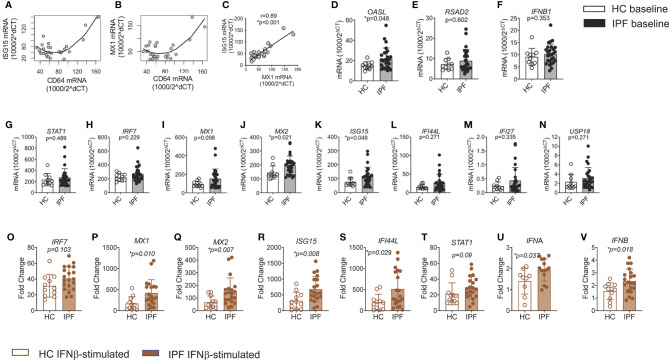
Figure 3.
Amplified response to type I IFN stimulation in monocytes from IPF. (A–C) Correlation of CD64 mRNA expression levels in IPF monocytes with ISG15 and MX1 levels; and between ISG15 and MX1 (C). (D–N) ISGs, IFNB1 and IFNAR expression in freshly isolated IPF monocytes vs HC, using qPCR. Results were expressed as relative gene expression - 1,000/2^(CT of target gene−CT of housekeeping genes). (O–V) Increased levels of ISG, STAT1, IFNA, and IFNB mRNA expression in IPF monocytes after culture in recombinant type 1 IFN for 18 h. Fold change refers to change over unstimulated values for that patient’s monocytes.

