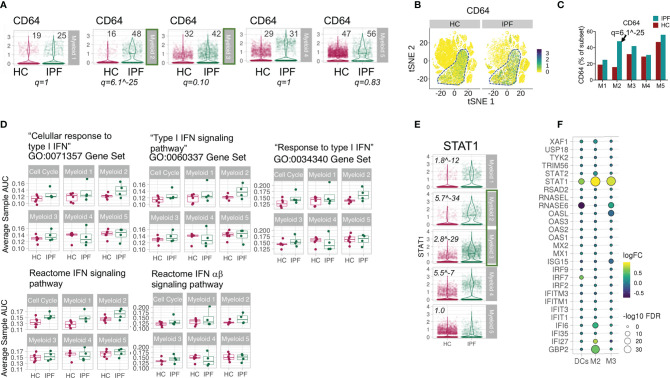
Figure 5.
Increased markers of type I IFN pathway in myeloid cells in IPF lungs. (A–C) Violin plots, tSNE and graph showing expression of CD64 in My1-5 subsets in lung digest. Numbers in plot of (A) refers to % of CD64 expressing cells in myeloid subcluster for HC and IPF patients. FDR q values applies to difference in expression between HC and IPF. (D) Average cell AUC value per sample per cluster representing enrichment of gene set in the transcriptome comparing IPF and HC samples. All p values >0.05 except for Myeloid 1 (My1) in Reactome IFN signaling pathway gene set - p=0.04 (Wilcoxon Rank Sum Test). (E) STAT1 expression in My1-5 depicted as violin plots. Italic values are FDR q values comparing HC and IPF. (F) Bubble plot reflecting expression of ISGs in My2, My3, and dendritic cells (DCs) depicted as fold change and FDR q, comparing IPF and HC, showing increased ISGs in My2 and My3 but not in DCs.

