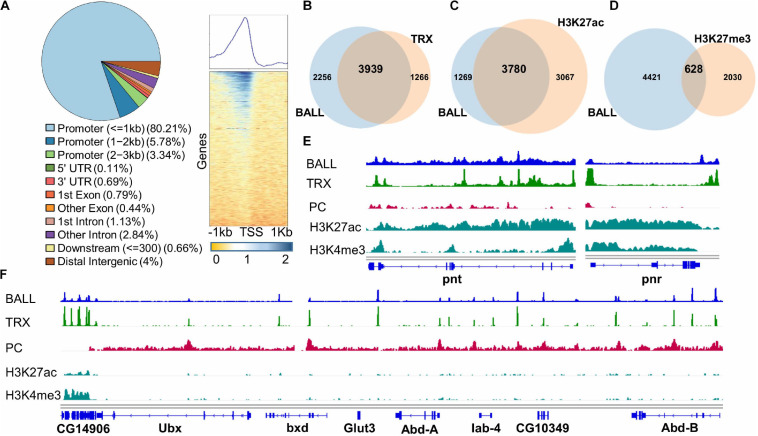
FIGURE 4.
Genome-wide binding profile of BALL analyzed by ChIP-seq from Drosophila S2 cells. (A) ChIPseeker was utilized to generate a pie chart that represents distribution of BALL across different regions of the genome. BALL is enriched predominantly in promoter (=1 kb) regions followed by promoter (1–2 kb) regions, distal intergenic regions and promoter (2–3 kb) regions. Heat map [(A), right panel] shows enrichment of BALL within 1 kb upstream of TSS of genes across the genome correlating with 80% occupancy of BALL in the promoter regions as shown in pie chart. (B–D) Lists of associated annotated peaks were generated for comparative analysis shown by Venn diagram analyses which show co-occupancy of BALL on known TRX peaks (B) and association of BALL with H3K27ac (C) and H3K27me3 (D) marked genes. (E) Genome Browser view of BALL enrichment compared to that of TRX, PC, H3K27ac, and H3K4me3 at pnt and pnr genes. (F) Genome Browser view of ChIP-seq data showing binding profile of BALL and its comparison with TRX, PC, H3K27ac, and H3K4me3 across the bithorax complex (BX-C). Highly enriched BALL and TRX correlates with high levels of both H3K27ac and H3K4me3 and absence of PC at CG14906, a gene present just downstream of Ubx. In contrast, PC is highly enriched throughout BX-C locus justifying the silenced state of Ubx, abd-A, and Abd-B genes in Drosophila S2 cells. Both BALL and TRX are present at few overlapping binding sites in BX-C.

