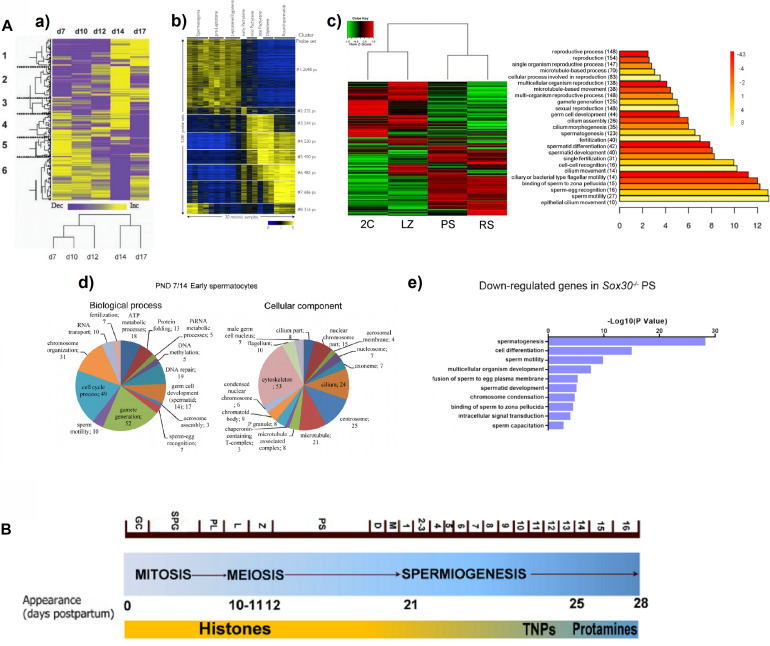
FIGURE 1.
(A) Examples from reports showing a switch in gene expression patterns, and the expression of spermiogenesis-specific programs during mouse meiotic prophase. (a) Heat map representing the clustering of 790 differentially expressed sequences derived from a microarray study in testes of animals of increasing age, from 7 days post-partum (d7) to 17 days post-partum (d17). Columns represent the expression profile of all the sequences for the indicated post-natal ages, while rows represent expression of specific genes over time (low expression levels are shown in purple, and high expression levels in yellow). Note the overall change from d12 to d14, coinciding with pachytene onset. A tree representing clustering by resemblance of expression profiles across the indicated post-natal ages is shown below. The figure is reproduced from Waldman Ben-Asher et al. (2010), with permission from John Wiley and Sons (license number 5014730359883). (b) Heat map showing the relative expression levels of 5,281 microarray probe sets divided into 8 K-means clusters, in different spermatogenic cell populations purified by FACS. Each horizontal line corresponds to a probe set (high expression in yellow, low expression in blue). The switch in the transcriptome between L/Z and mid-P is evident. Reprinted from Fallahi et al. (2010), under the Creative Commons Attribution License. (c) Heat map of expression levels and hierarchical clustering for the global differential gene expression in four FACS-sorted spermatogenic cell populations, profiled through RNAseq (2C, spermatogonia and somatic testicular cells; LZ, leptotene/zygotene; PS, pachytene spermatocytes; RS, round spermatids). High expression: red; low expression: green. To the right, the main enriched GO terms for biological process category (BP) of the upregulated genes in PS are shown. The heat map evidences a switch in gene expression patterns from L/Z to PS, while the GO analysis shows enrichment in spermiogenesis-related terms. Reproduced from da Cruz et al. (2016), under the Creative Commons Attribution License. (d) Pie charts showing enriched BP and cellular component (CC) GO terms among upregulated genes in the testes of animals at post-natal day 14 compared to those of post-natal day 7 (PND7/14), obtained from an RNAseq study. Note the upregulation of spermiogenesis-related terms both for BP and CC categories. The figure is reproduced from Laiho et al. (2013), under the Creative Commons Attribution License. (e) GO term enrichment analysis for downregulated transcripts in PS of Sox30–/– mice compared to WT, as assessed through RNAseq of STA-PUT-isolated stage-specific spermatogenic cells. Reprinted from Bai et al. (2018), with permission from The Company of Biologists Ltd.; permission conveyed through Copyright Clearance Center, Inc. (B) Diagram representing the three main spermatogenic phases, and the timing of mouse spermatogenesis. The different cell types and the onset of some of them (days postpartum) are indicated. The substitution of histones – first by transition proteins (TNPs) and then by protamines – is shown as well. GC, gonocytes; SPG, spermatogonia; PL, preleptotene; L, leptotene; Z, zygotene; PS, pachytene; D, diplotene; M, meiotic divisions; 1–16 represent the different spermatid stages. Adapted from Trovero et al. (2020), under the Creative Commons Attribution License.

