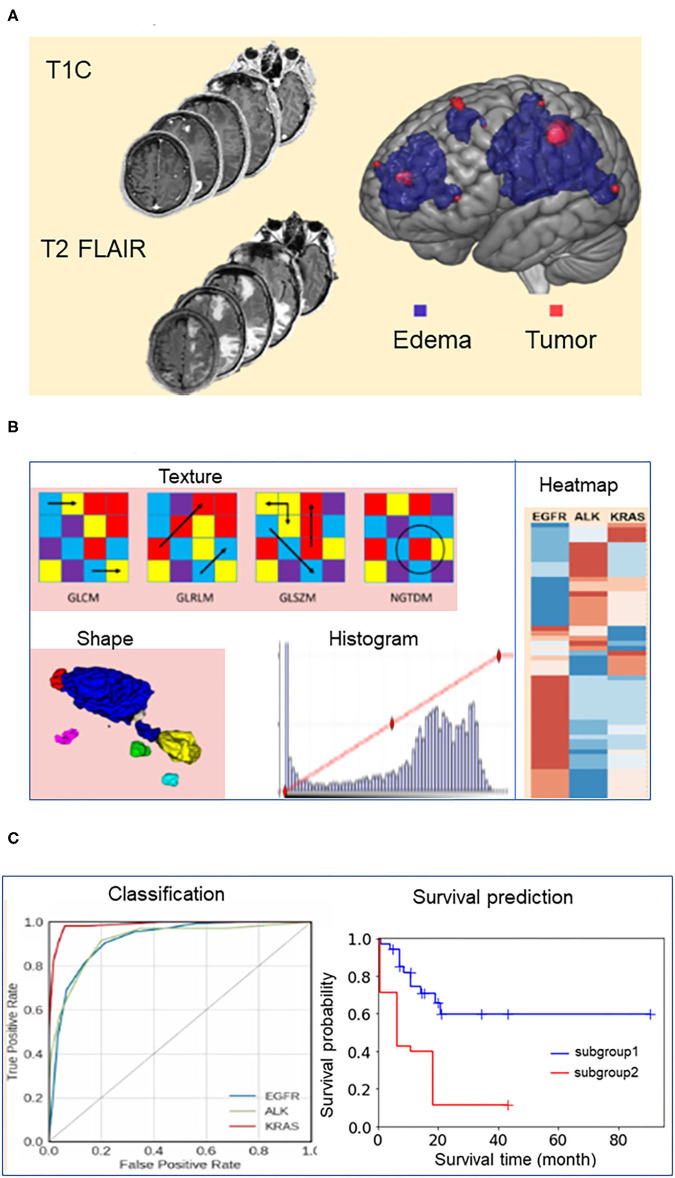
Figure 1.
Schema for brain tumor segmentation, radiomic feature extraction, and predictive modeling. (A) Representative tumor segmentation images from post-contrast T1-weighted (T1C) and T2-weighted fluid-attenuated inversion recovery (FLAIR) data. (B) Illustrations of radiomic features extracted from the brain tumor images, including texture, shape, and intensity. GLCM, Gray Level Co-occurrence Matrix; GLRLM, Gray Level Run Length Matrix; GLSZM, Gray Level Size Zone Matrix; NGTDM, Neighboring Gray Tone Difference Matrix. (C) Receiver operating characteristic (ROC) curves for the models predicting the survival durations of patients in each of the three mutation-positive groups (EGFR, ALK, and KRAS mutation-positive groups) and representative survival duration analysis.

