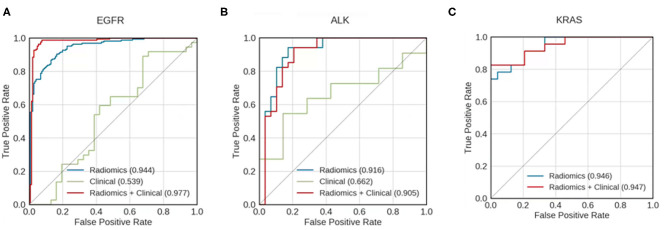
Figure 3.
Receiver operating characteristic (ROC) curves for models predicting whether patients with mutations of (A) EGFR, (B) ALK, and (C) KRAS survived longer than the median survival duration of the mutation-positive group. Curves are shown for models using clinical data only (green), radiomics features only (blue), and a combination of both clinical data and radiomic features (red). The areas under the receiver operating characteristic curves (AUCs) are indicated in each panel. KRAS mutation—positive group has too small a sample size to build the predictive model using clinical data alone.

