FIGURE 7.

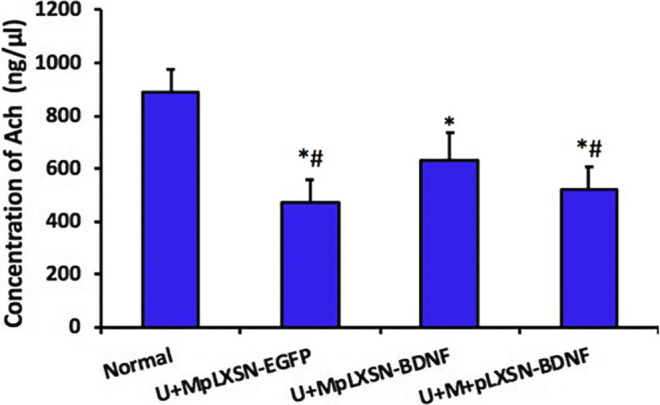
HPLC detection of Ach concentration in each group. *p < 0.05, **p < 0.01 compared with the normal group, # p < 0.05 compared with the U + MpLXSN-BDNF group.

HPLC detection of Ach concentration in each group. *p < 0.05, **p < 0.01 compared with the normal group, # p < 0.05 compared with the U + MpLXSN-BDNF group.