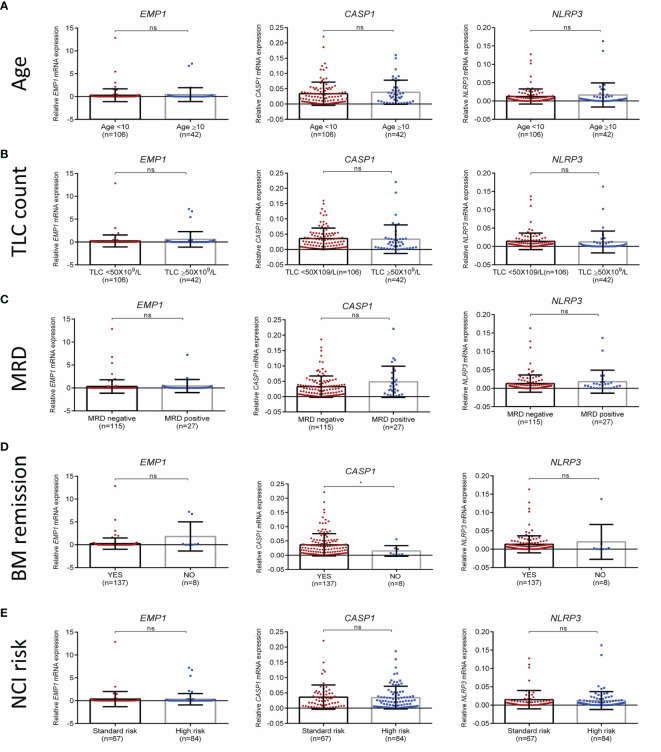
Figure 3.
Association of EMP1, CASP1, and NLRP3 expression with (A) age, (B) total leukocyte count at diagnosis (C) MRD status (D) BM remission status, and (E) NCI risk. TLC, total leukocyte count; NCI, national cancer institute, USA based risk stratification; BM, bone marrow; ****p < 0.0001; ***p < 0.001; **p < 0.01; *p < 0.05; ns, not significant (p > 0.05).

