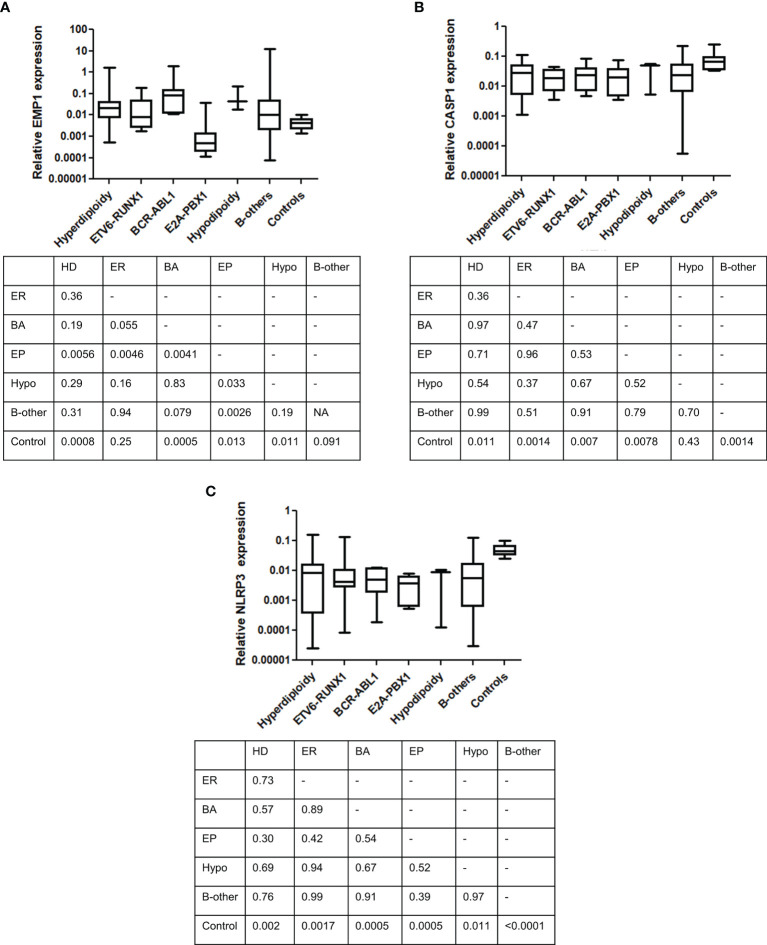
Figure 4.
Comparison of gene expression between different cytogenetic subgroups. (A) EMP1, (B) CASP1, and (C) NLRP3. Table below each figure panel represents results of Mann-Whitney U test analysis between each respective group. ER, ETV6-RUNX1; EP, E2A-PBX1; BA, BCR-ABL1; Hypo, hypodiploidy; HD, hyperdiploidy.

