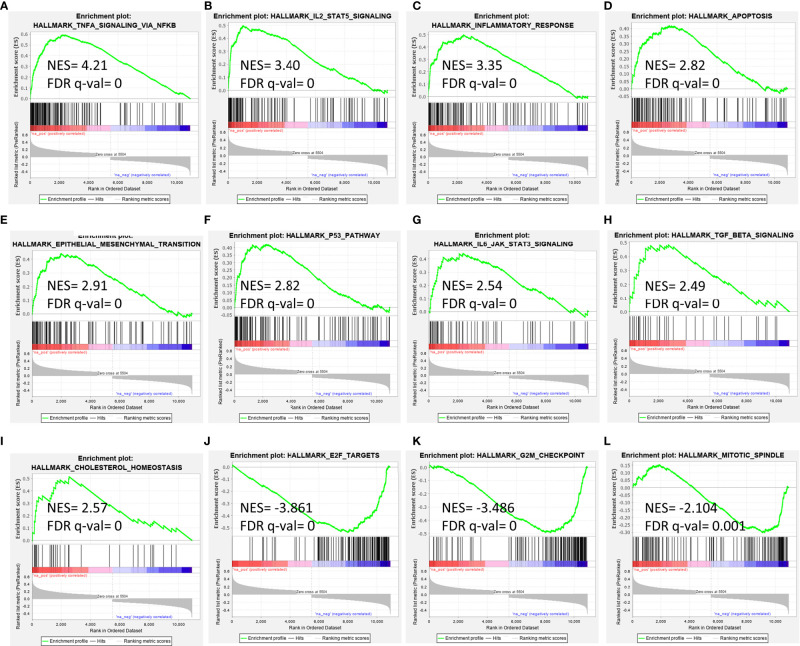
Figure 5.
Gene set enrichment analysis for EMP1 correlated genes in B-ALL (A–I) positively correlated pathways, (J–L) negatively correlated pathways. Gene expression data from diagnostic bone marrow samples of B-ALL from Leukemia MILE study was utilized to extract EMP1 associated genes and analyzed by GSEA tool. NES, normalized enrichment score; FDR, false detection rate.

