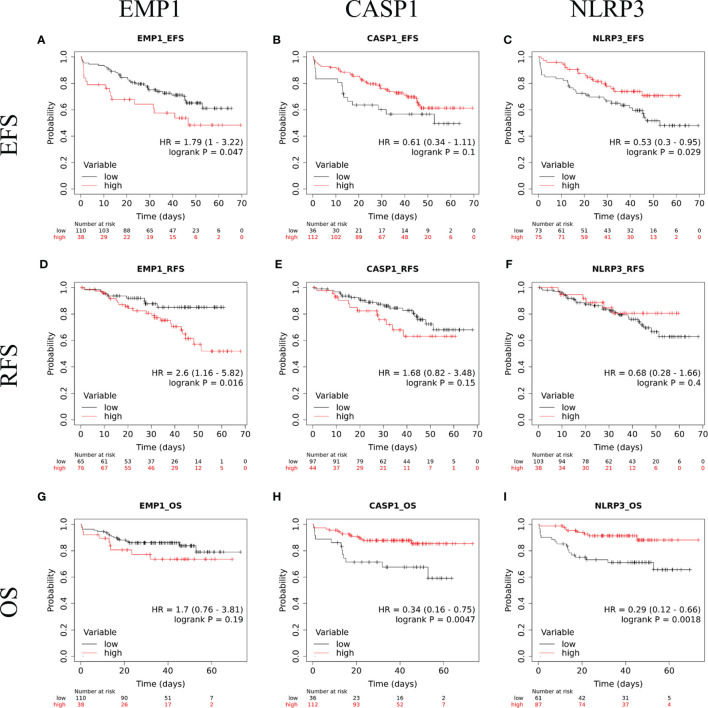
Figure 6.
Kaplan Meir survival plots comparing EFS in B-ALL patients with (A) EMP1-high and EMP1-low expression (B) CASP1-high and CASP1-low expression (C) NLRP3-high and NLRP3-low expression; RFS in B-ALL patients with (D) EMP1-high and EMP1-low expression (E) CASP1-high and CASP1-low expression (F) NLRP3-high and NLRP3-low expression; OS in B-ALL patients with (G) EMP1-high and EMP1-low expression (H) CASP1-high and CASP1-low expression (I) NLRP3-high and NLRP3-low expression. HR, hazard ratio; EFS, event free survival; RFS, relapse free survival; OS, overall survival.

