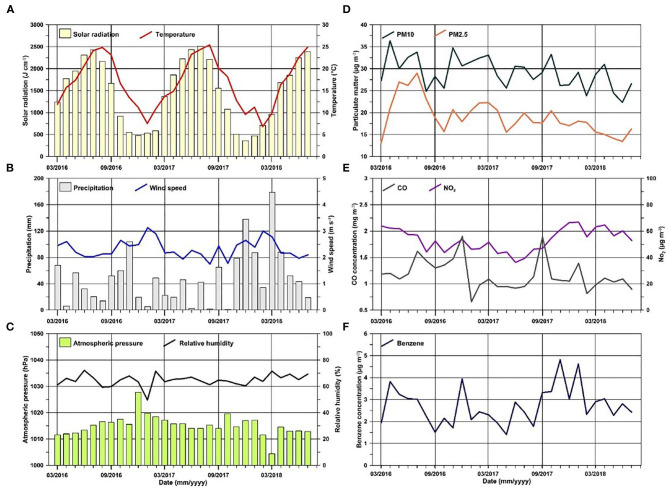
Figure 1.
Monthly distribution of (A) solar radiation (pale yellow bars) and temperature (red line); (B) precipitation (gray bars) and wind speed (blue line); (C) atmospheric pressure (green bars) and relative humidity (black line); (D) particulate matter concentrations (PM10-dark green line and PM2.5-orange line); (E) CO (gray line) and NO2 (violet line) concentrations; (F) benzene concentrations (dark blue line).

