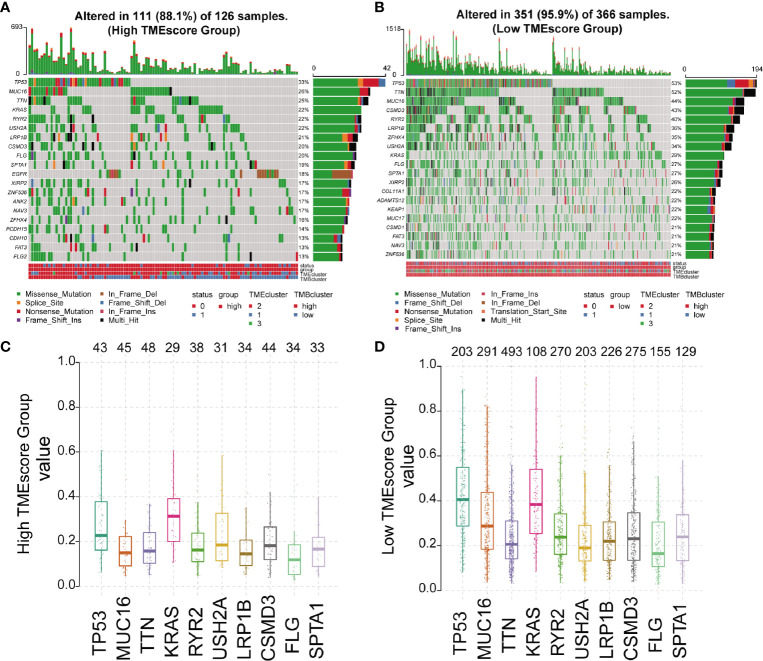
Figure 3.
Mutation profiles of different TMEscore subgroups. (A, B) Waterfall plots exhibiting the mutation profiles of patients with high/low-TMEscore in which various colors with annotations at the bottom represented the different mutation types and tumor mutation burden; (C, D) Boxplots showing the mutation frequency of the 10 most frequently mutated genes in high- and low-TMEscore subgroups.

