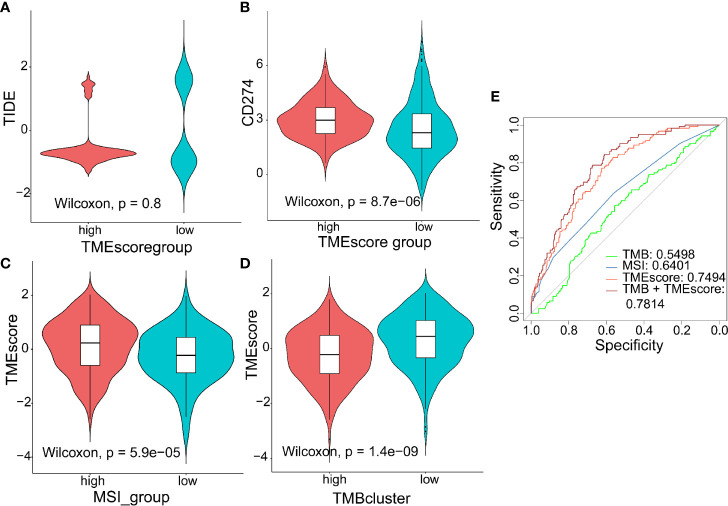
Figure 5.
Predictive value of TMEscore as a biomarker for immunotherapy. (A, B) Violin plot showing TIDE score and PD-L1 level between the high- and low-TMEscore subgroups; (C, D) Violin plot showing TMEscores in groups with different microsatellite instability (MSI) status and with different TMB levels; (E) ROC curves to compare the accuracy of TMB, MSI and TMEscore in predicting responses to immunotherapy.

