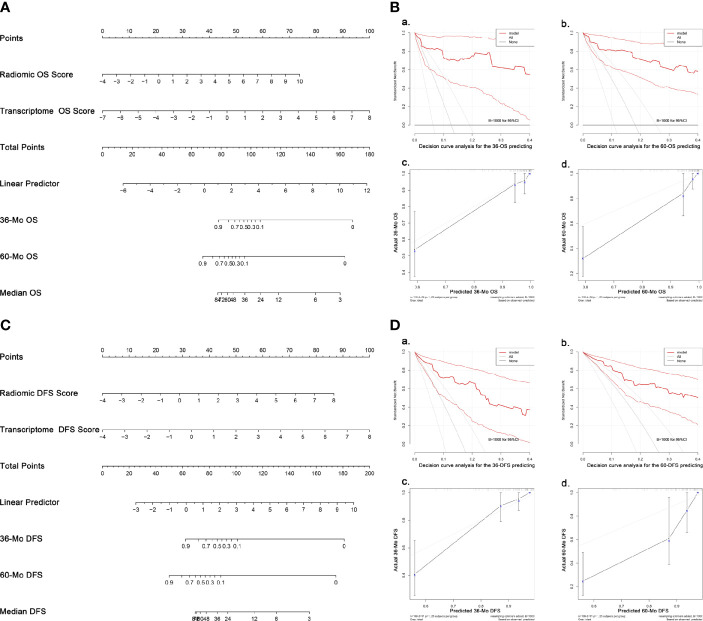
Figure 5.
Nomograms and validation of the OS- and DFS-predicting models. (A) Nomogram predicting OS. (B) Validation of the OS-predicting model: (A, B) DCA of the nomogram predicting 36-Mo and 60-Mo OS. (C, D) Calibration curves showing the probability of 36-Mo and 60-Mo OS between model prediction and actual observation. (C) Nomogram predicting DFS. (D) Validation of the DFS-predicting model: (A, B) DCA of the nomogram predicting 36-Mo and 60-Mo DFS. (C, D) Calibration curves showing the probability of 36-Mo and 60-Mo DFS between model prediction and actual observation. In DCA plot, the X-axis shows the threshold probabilities while the Y-axis shows the net benefit (adding true positives and subtracting false positives). The black horizontal line along the x-axis assumes that no patients died (or progressed) whereas the gray line assumes that death (or progression) occurred in all cases. DCA and calibration curve analyses were carried out using 1000 bootstrapping replications. The bootstrapped 95%CIs of the decision curves and calibration curves are present. OS, Overall survival; DFS, Disease-free survival; DCA, Decision curve analyses, CI, Confidence interval.

