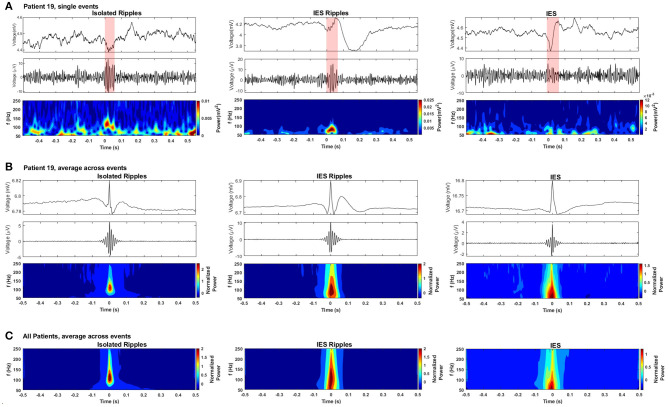
Figure 4.
Detected hippocampal ripples and spikes. (A) Selected events from each event type: the- first row shows the waveform from the raw EEG, the second row shows the waveform from the bandpassed EEG (80–250 Hz), the third row shows the spectrogram from each event-type obtained using a Morlet wavelet transform. (B) Average event-types from patient 19. (C) Grand average of the three event-types from all patients.

