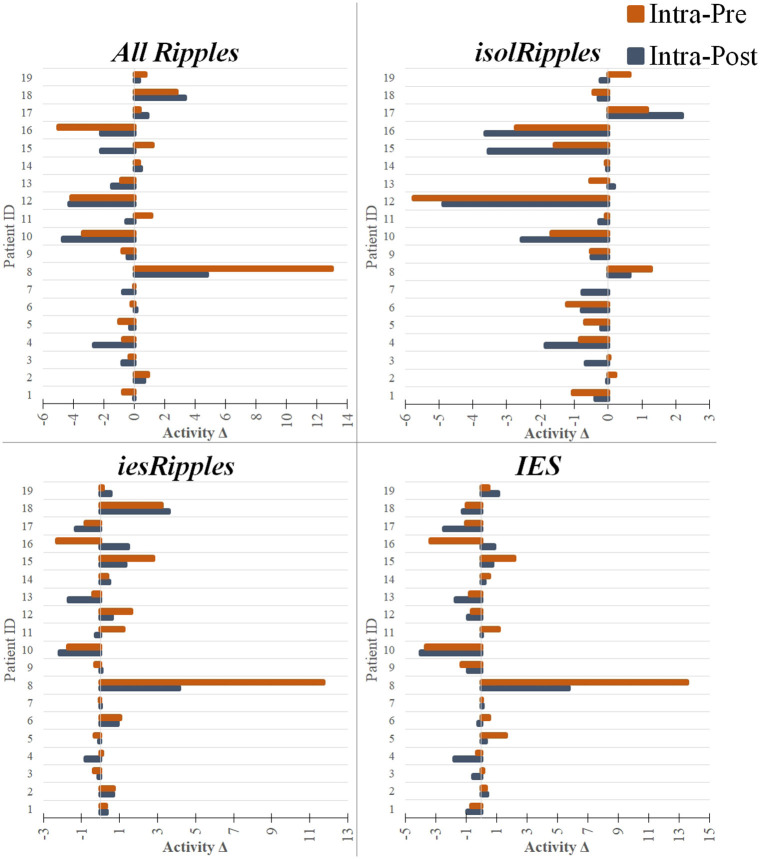
Figure 5.
Modulation of the event-classes by the increased cognitive load. The bar plots show pairs of activity differences between phases (Activity Δ), i.e., difference between the intra- and pre-paradigm phase (orange) and difference between the intra- and post-paradigm phase (blue), for each patient and using each of the event-classes. The bar plots with a negative value indicate a decrease in activity when entering or leaving the period of increased cognitive load (i.e., intra-paradigm phase). The bar plots with a positive value indicate an increase in activity during the paradigm when compared to the pre- or post-paradigm phases. The hippocampal isolRipples were the only event-class to show a significant modulation by the navigation task, presenting an activity decrease when comparing the intra-paradigm occurrence rates with those from both the preceding (pre-paradigm, p < 0.043) and succeeding (post-paradigm, p < 0.007) control phases.

