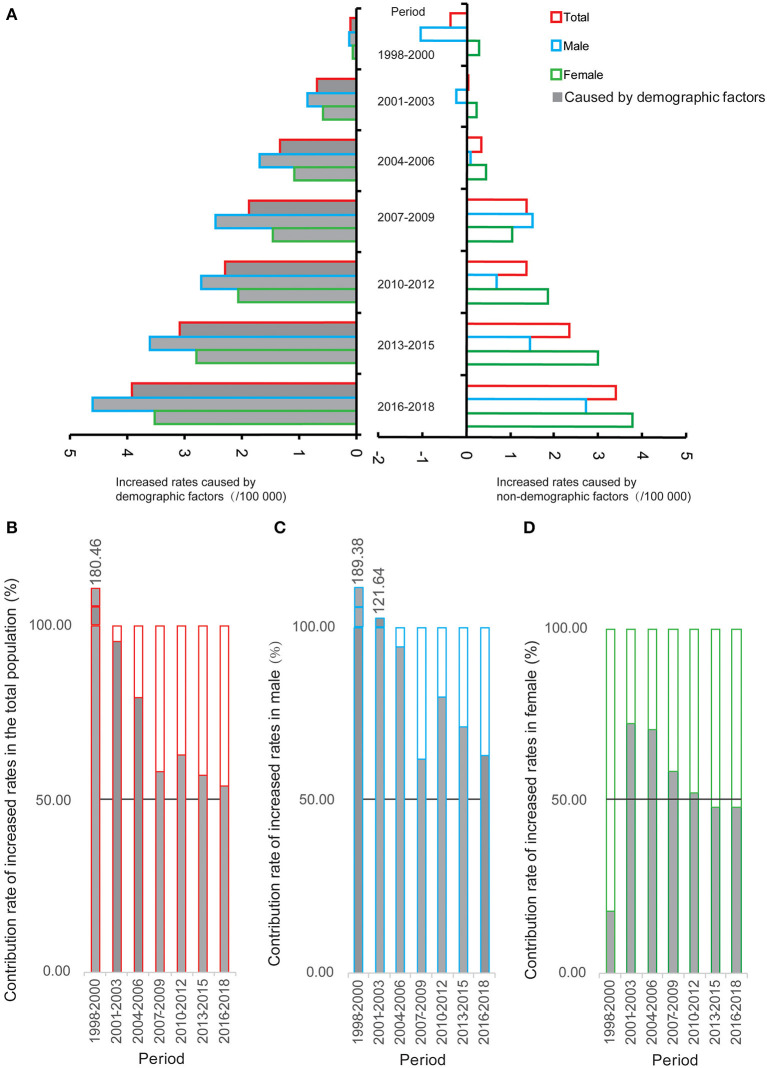
Figure 2.
The increased rates related to demographic and non-demographic factors and their proportion during the period from 1998 to 2018 compared with the crude mortality rate of selected neurological disorders during 1995–1997 in Pudong New Area, Shanghai, China. (A) The increased rates; (B) the contribution rate of increased rates in the total population; (C) the contribution rate of increased rates in males; (D) the contribution rate of increased rates in females.

